Token Terminal is a comprehensive on-chain data platform specializing in standardizing financial and alternative data for popular blockchains, while also providing tools to assess and monitor promising projects.
Written by: Anatol Antonovici | Updated January 25, 2024
Reviewed by: Mike Martin
Fact checked by: Ryan Grace

Token Terminal is a leading blockchain data analysis tool. In this article, you’ll learn how to use it.
Table of Contents
🍒 tasty takeaways
Token Terminal is one of the top fundamental analysis platforms for crypto assets, decentralized applications (dapps), and blockchains.
The platform offers a wide range of metrics for free, with more advanced options for paid subscribers via its Pro version.
You can register with your email to access the Pro version’s 7-day trial without sharing payment details.
Token Terminal Summary
| Feature | Description |
|---|---|
| Data Standardization | Standardizes data for blockchains and decentralized apps |
| Data Analysis | Analyzes and transforms blockchain transactions into business metrics |
| Metrics Offered | Provides market, financial data, and performance indicators |
| Project Analysis | Enables comprehensive market and project analysis with financial and trend tools |
| Multi-Chain Support | Supports data extraction and analysis across multiple blockchains |
| API Access | Offers API for programmatic access to data sets and metrics |
| Data Room | Provides a space for in-depth data queries and analysis |
| User-Friendly Interface | Features an intuitive interface for easy navigation and data visualization |
What Is Token Terminal?
Token Terminal is an on-chain blockchain data platform offering key metrics across multiple decentralized networks and decentralized finance (DeFi) apps. Investors, analysts, developers, and other market participants can use the platform to conduct in-depth fundamental analysis and technical analysis while staying in touch with market dynamics.
Token Terminal doesn’t depend on any third parties or oracle networks to extract on-chain data. Instead, it relies on its node infrastructure to obtain quality data and transform it into readable metrics.
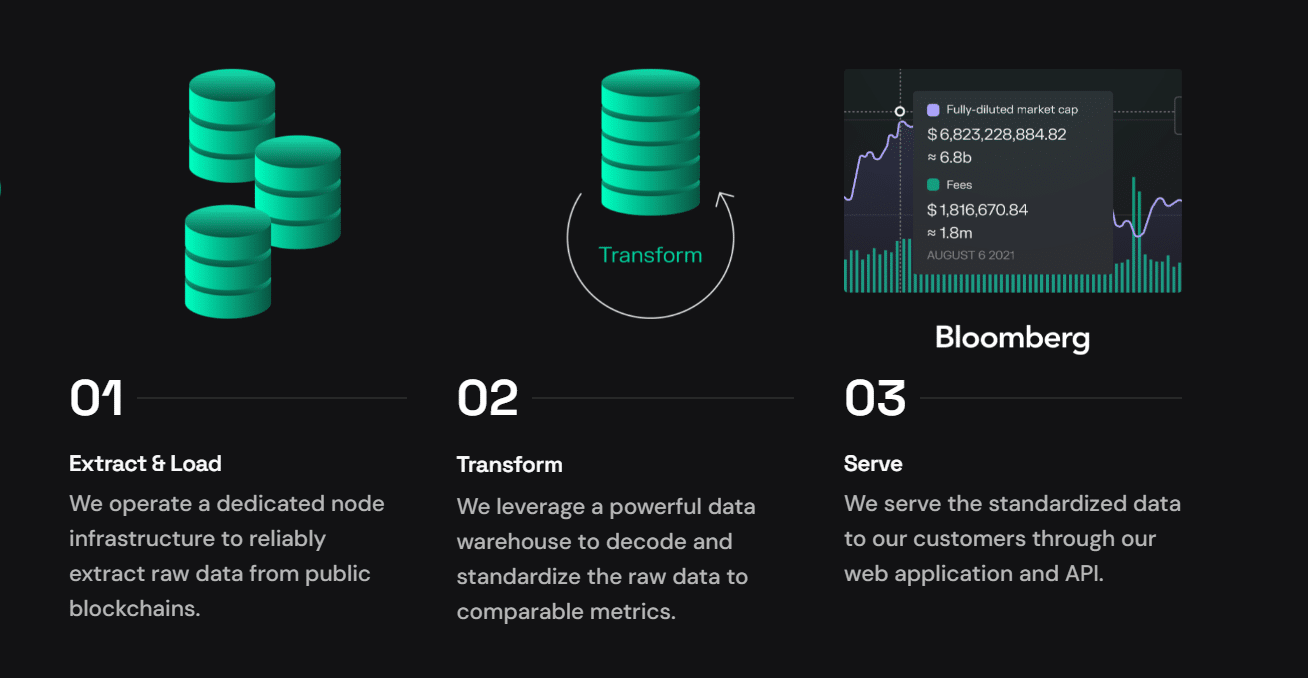
Source: Token Terminal’s Data Pipeline
Token Terminal’s Products
The platform’s flagship product is the Terminal, which offers a wide range of metrics for free, with more advanced metrics available to paid subscribers.
Registered developers and technical teams can also use the platform’s Data Room, where they can query and analyze multichain data using SQL and Terminal API, which enables developers to leverage standardized data sets programmatically.
Secure Your Crypto With Self-Custody
When you store your crypto in a self-custody wallet, you don’t have to trust that an exchange is acting in your best interest. This is because you are the only party privy to your private key, or seed phrase.
Here are some additional benefits you get when you choose to self-custody your digital assets with tastycrypto:
- In-App Swap: Trade BTC, ETH, and 1,000+ tokens
- Generate Yield in DeFi: Stake, lend, and become your own market maker
- NFTs: Buy, sell, and view NFTs in-app
tastycrypto offers both iOS and Android self-custody wallets – download yours today! 👇
What Can I Do on Token Terminal?
You can use Token Terminal to analyze key metrics of the cryptocurrency market, its main sectors, as well as individual decentralized applications (dapps) and blockchain networks like Bitcoin (BTC) and Ethereum (ETH).
Investors and analysts can explore key metrics such as market capitalization, total value locked (TVL) in DeFi, transaction fees, active users, trading volume, and more.
All metrics are available for general market analysis and for about 270 projects listed on Token Terminal. The projects include the following:
- Over 40 layer 1 and layer 2 chains, including Bitcoin, Ethereum, Solana, Avalanche, Polygon, Cardano, and Cosmos.
- More than 150 dapps, including Aave, Uniswap, and Lido.
- 21 stablecoin issuers, including Circle, Tether, and MakerDAO.
- 15 non-fungible token (NFT) marketplaces, including OpenSea, Blur, and LooksRare.
For better visualization, the metrics are displayed on charts with customizable, user-friendly options.
How Do I Use Token Terminal for Free?
Token Terminal enables retail users to access a wide range of metrics for free.
Market Analysis
To analyze the crypto market, the DeFi ecosystem, and major blockchain sectors, you should access the first three sections on the left menu: Home, Metrics, and Sectors.
Home
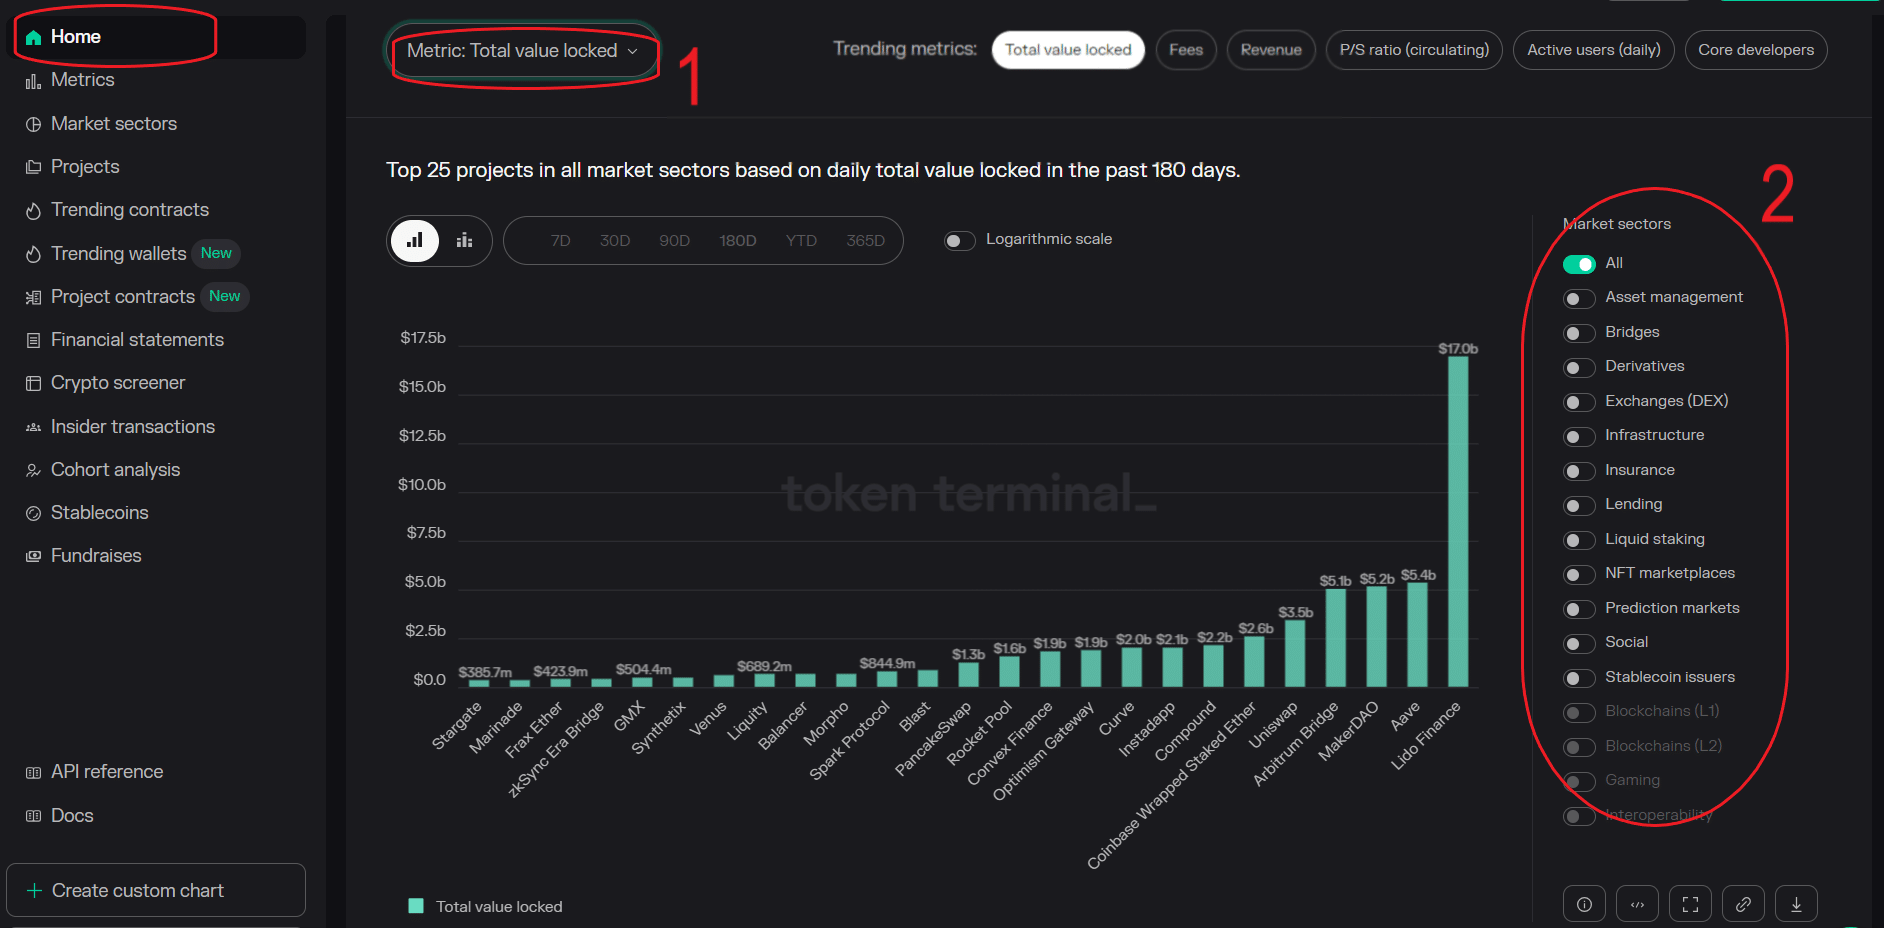
On the Home page, you can visualize multiple metrics by scrolling on the top tab (1). You can also select key sectors on the right side (2).
Source: Token Terminal
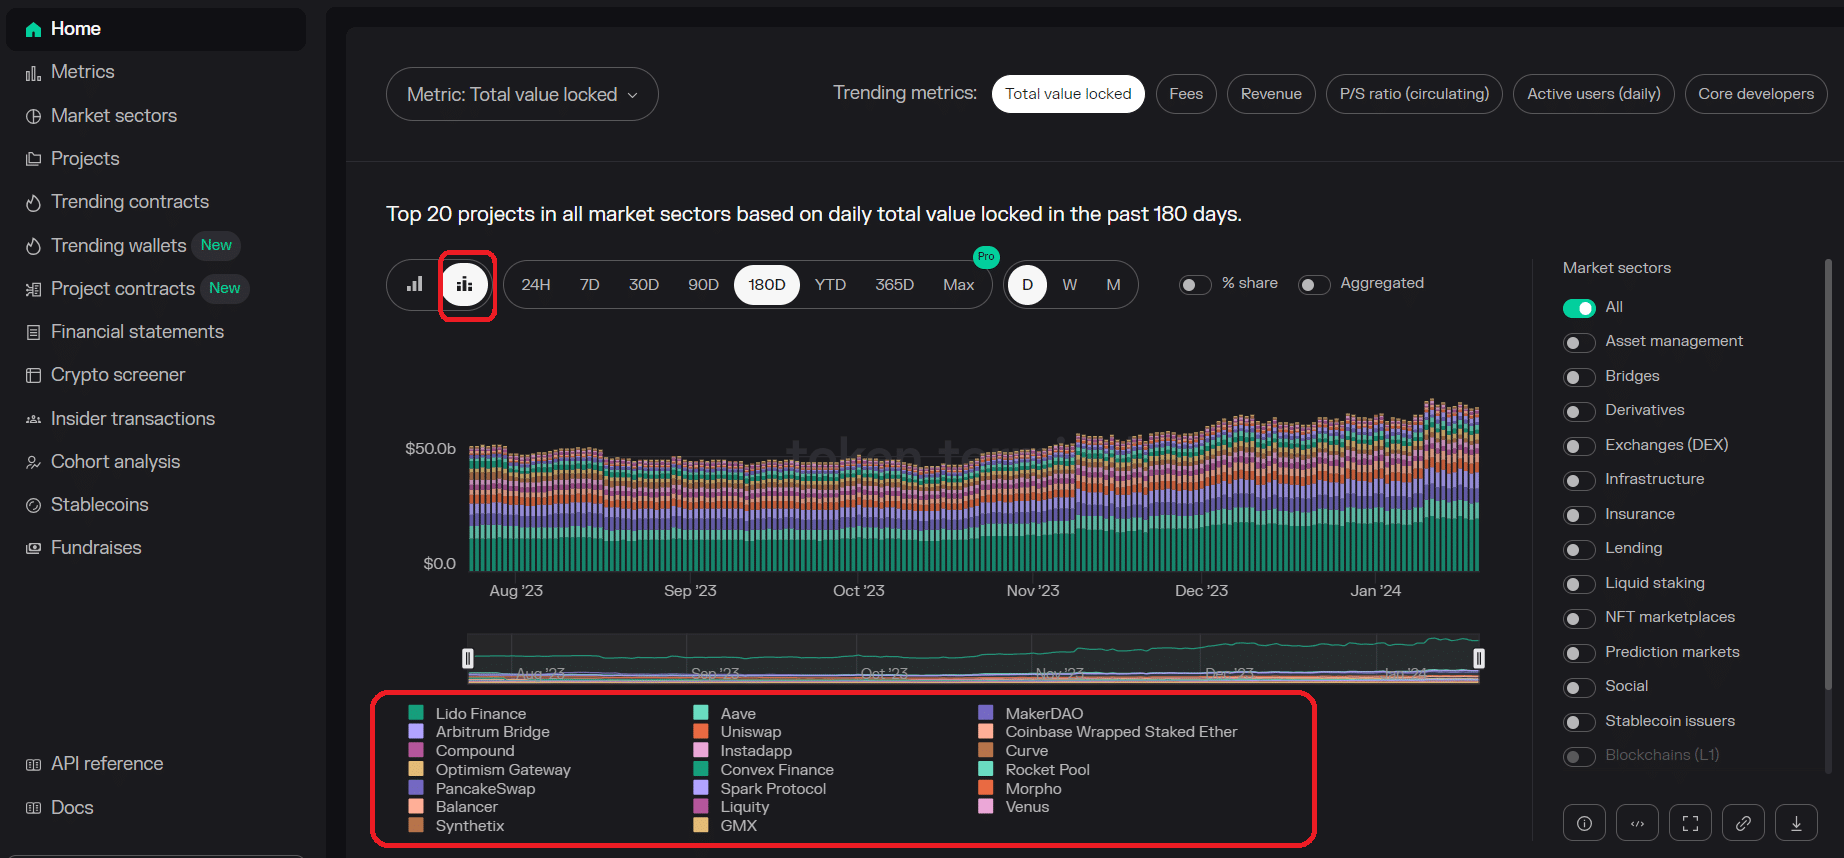
In addition to cumulative project data, you can also visualize the chronological dynamic by switching the display option at the top of the chart. Here, you can choose the timeframe and hide specific projects.
Source: Token Terminal
Below the main chart, you will find weekly gainers and losers across several metrics:
Source: Token Terminal
Metrics
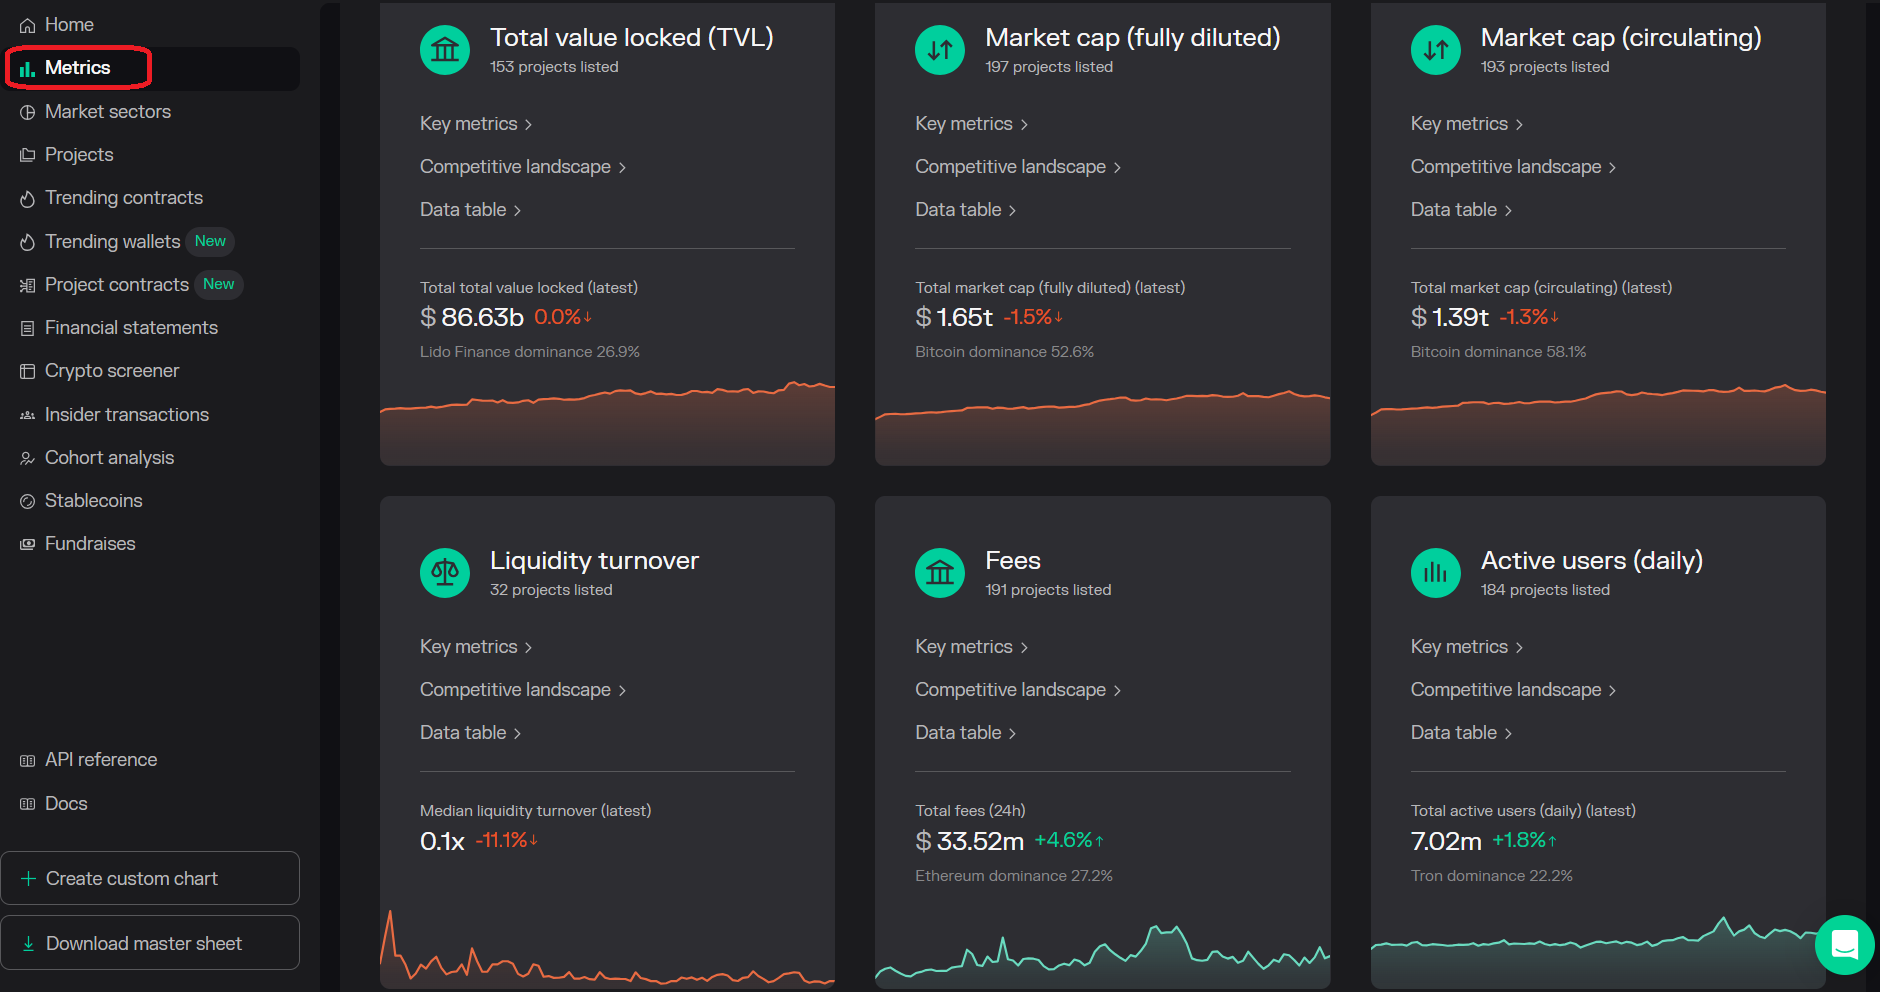
On the Metrics page, you can visualize every single metric for the crypto market and its main sectors.
Source: Token Terminal
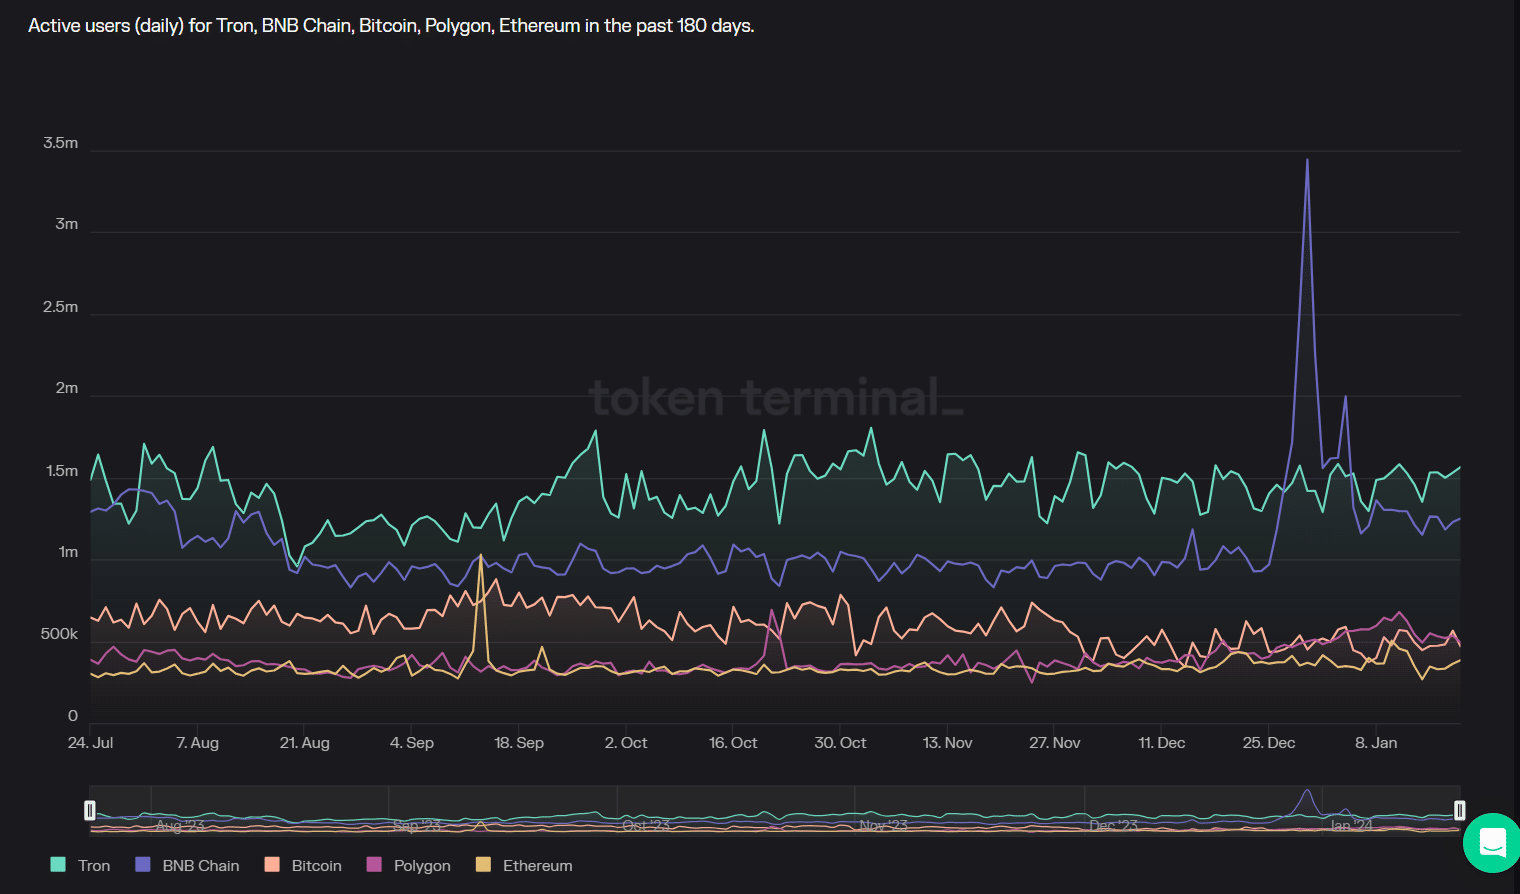
By clicking on any metric, e.g., active users, you can see general info about the metric, a standard chart like the one on the Home page, and a Competitive Landscape chart that shows the evolution of the metric across individual blockchains and Web3 projects. Here you can select the timeframe and add any of the supported dapps, digital assets, or networks.
Source: Token Terminal
Market Sectors
On the Market Sectors page, you can analyze key metrics across 16 sectors, although only three are available for free: Social, Decentralized Exchanges (DEXs), and Layer 1 chains.
For each sector, you will find some general info and two charts: the standard one and the Competitive Landscape one.
Project Analysis
In addition to market analysis, you can do an in-depth scan of each of the 270 dapps and networks listed on the platform. You can access them through the Projects page, but a more straightforward approach is to look for each project in the search box at the top of the page.
For each dapp or blockchain network, you will see two main sections: an overview dashboard and a chart that can be customized to visualize multiple metrics.
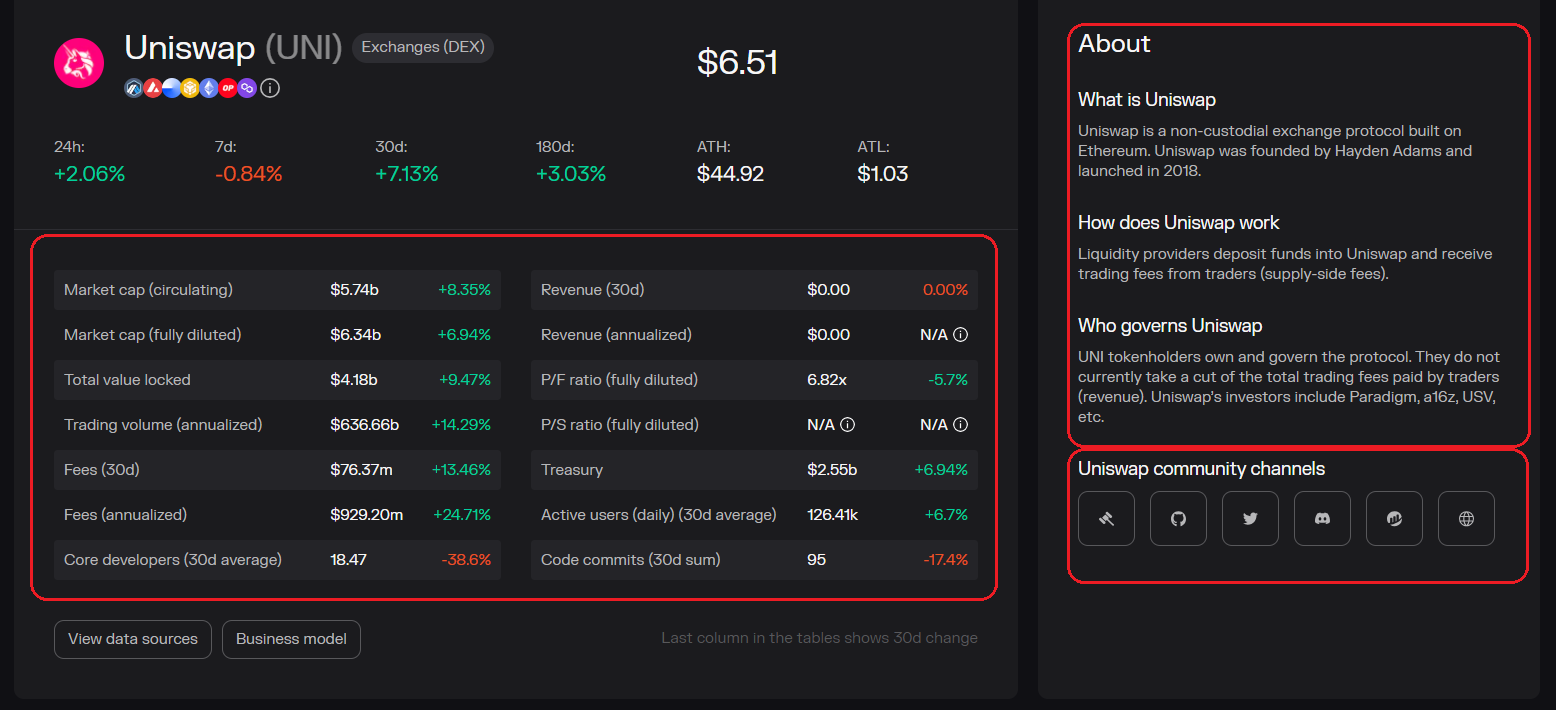
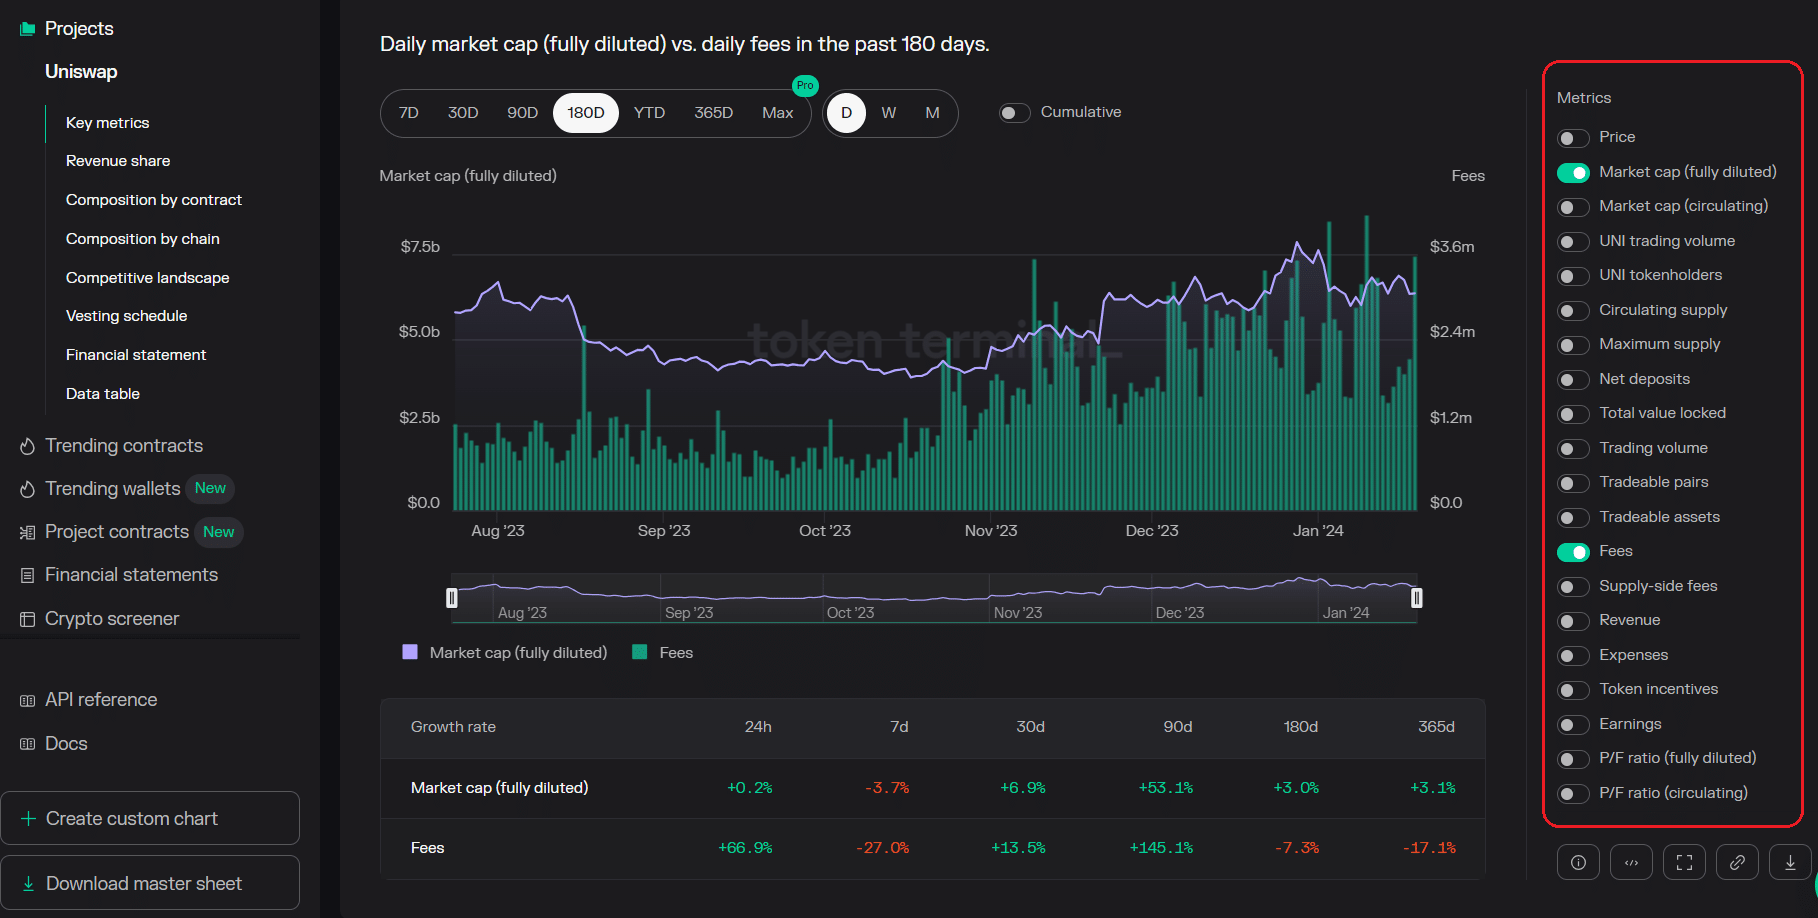
Let’s use Uniswap as an example, one of the most popular DEXs. Here is what the overview section looks like – it shows key metrics with 30-day changes and some general info on the right side, along with social channels.
Source: Token Terminal
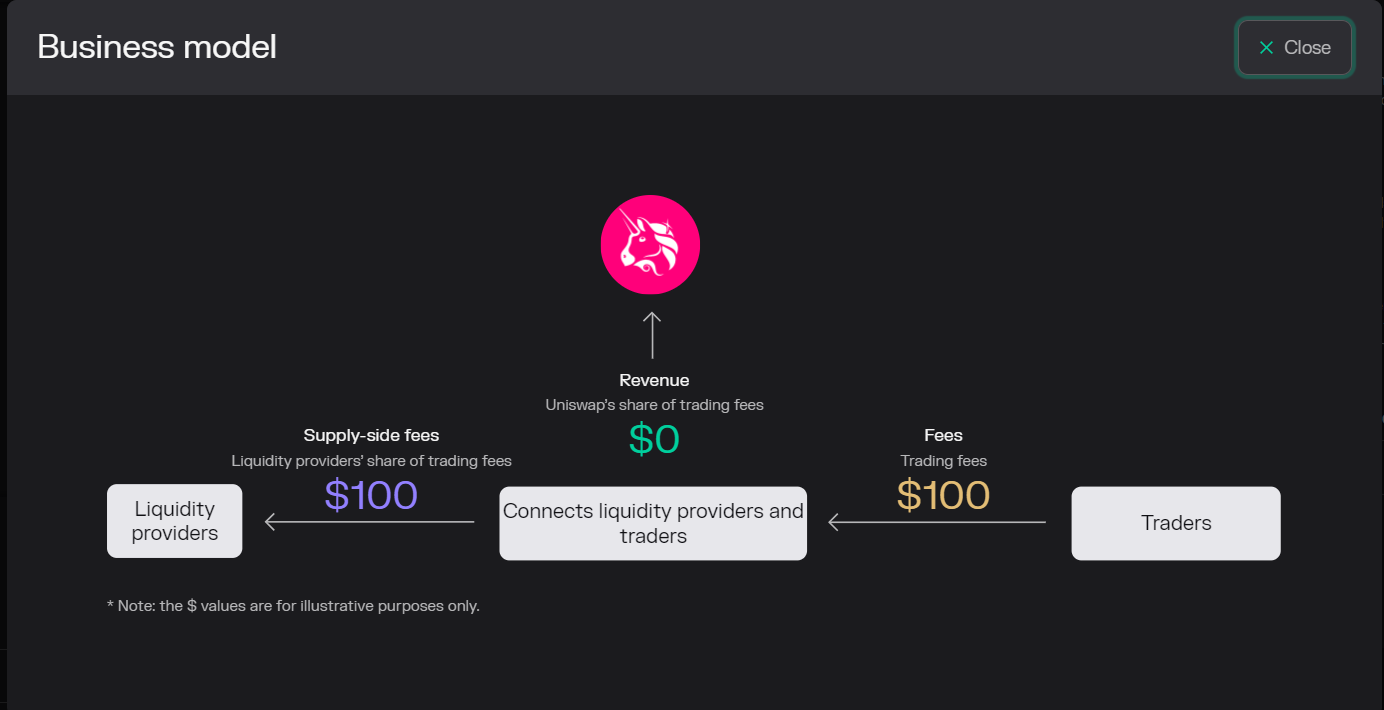
For certain dapps, you can learn their functionality by clicking on the ‘Business Model’ tab located just below the metrics table.
Source: Token Terminal
You can scroll below the overview section to access the project’s chart, where you can visualize all the metrics, which can be selected on the right side. You can compare any two metrics you want.
Source: Token Terminal
Financial Statements
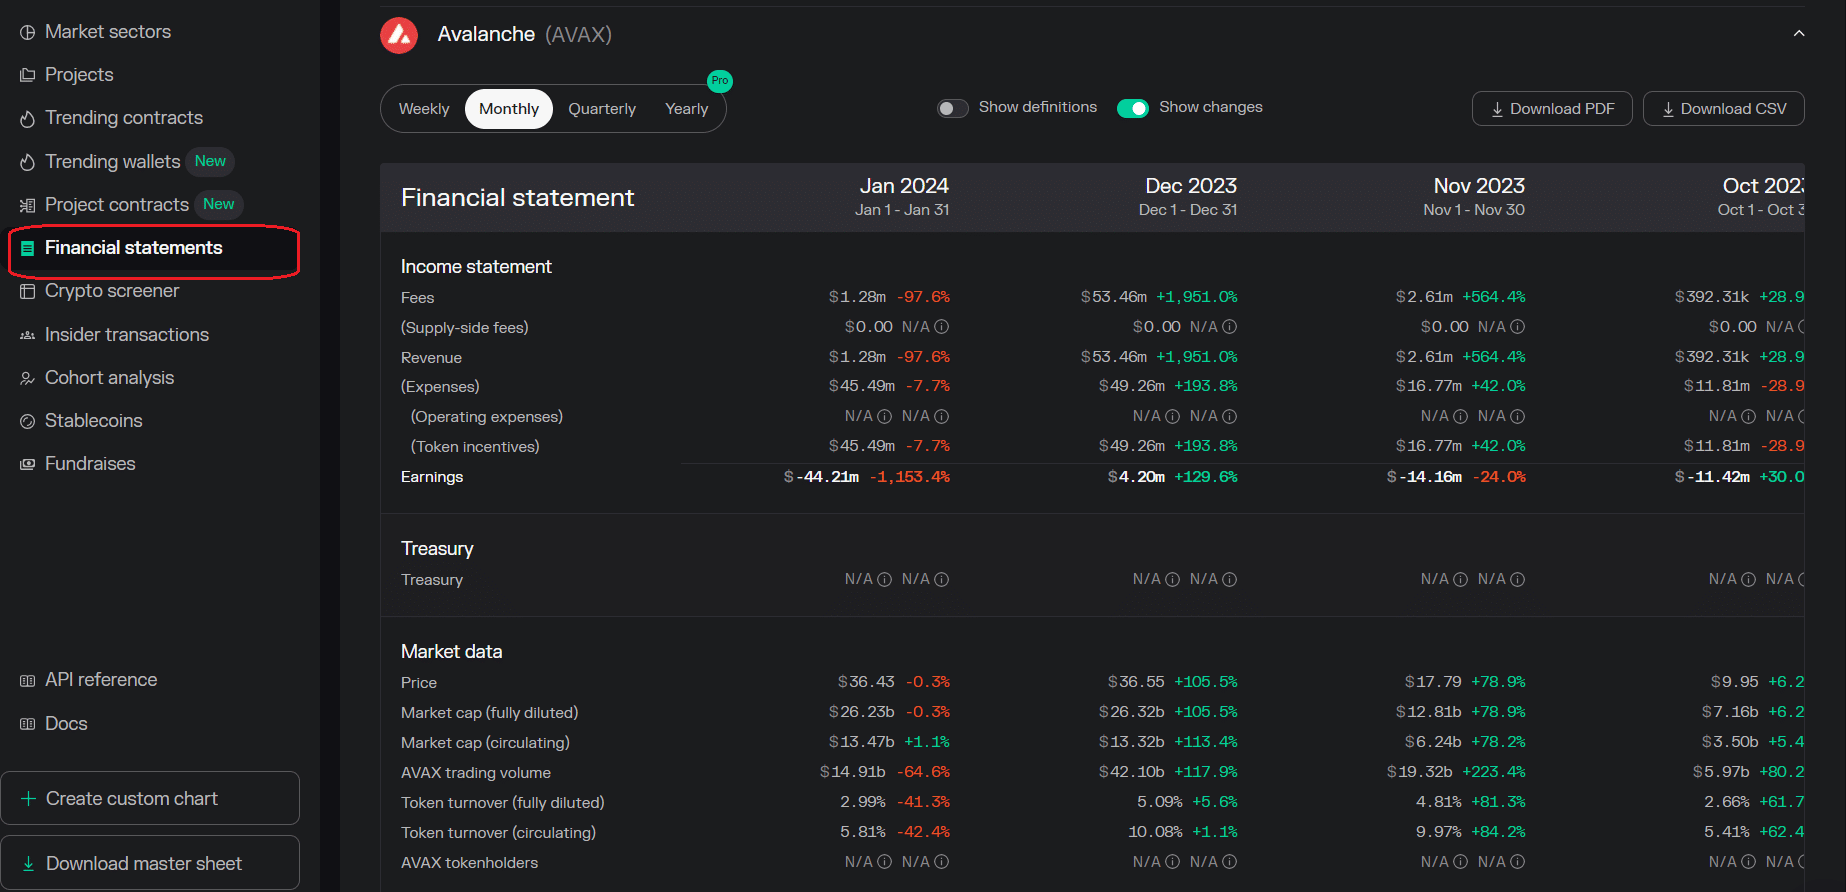
One of the features that I like about Token Terminal is the ‘financial statements’ tool. It shows the weekly, monthly, or quarterly dynamics of fees, revenue, token prices, and more.
Source: Token Terminal
What Do You Get with the Pro Version?
The free version of the terminal provides great value to retail users, but if you want advanced features, you can pay over $300 per month to access all the features and perks of Terminal Pro.
Here is what subscribers get with the Pro version:
- Extend timeframes to access all data on charts since launch.
- Access all metrics in the ‘Metrics’ section, including active users (weekly and monthly), active loans, average fees and revenue per user, earnings, volume, liquidity turnover, gross profit, core developers, code commits, and more.
- Access all sectors on the ‘Market Sectors’ page.
- Access a wide range of data sets in table format, including the Crypto Screener, Insider Transactions, Trending wallets, Project Smart Contracts, and Stablecoins.
- Access the Fundraises section that displays relevant funding rounds of blockchain and Web3 projects.
- Access the Cohort Analysis tool, which displays the retention rate of monthly active user cohorts for each project.
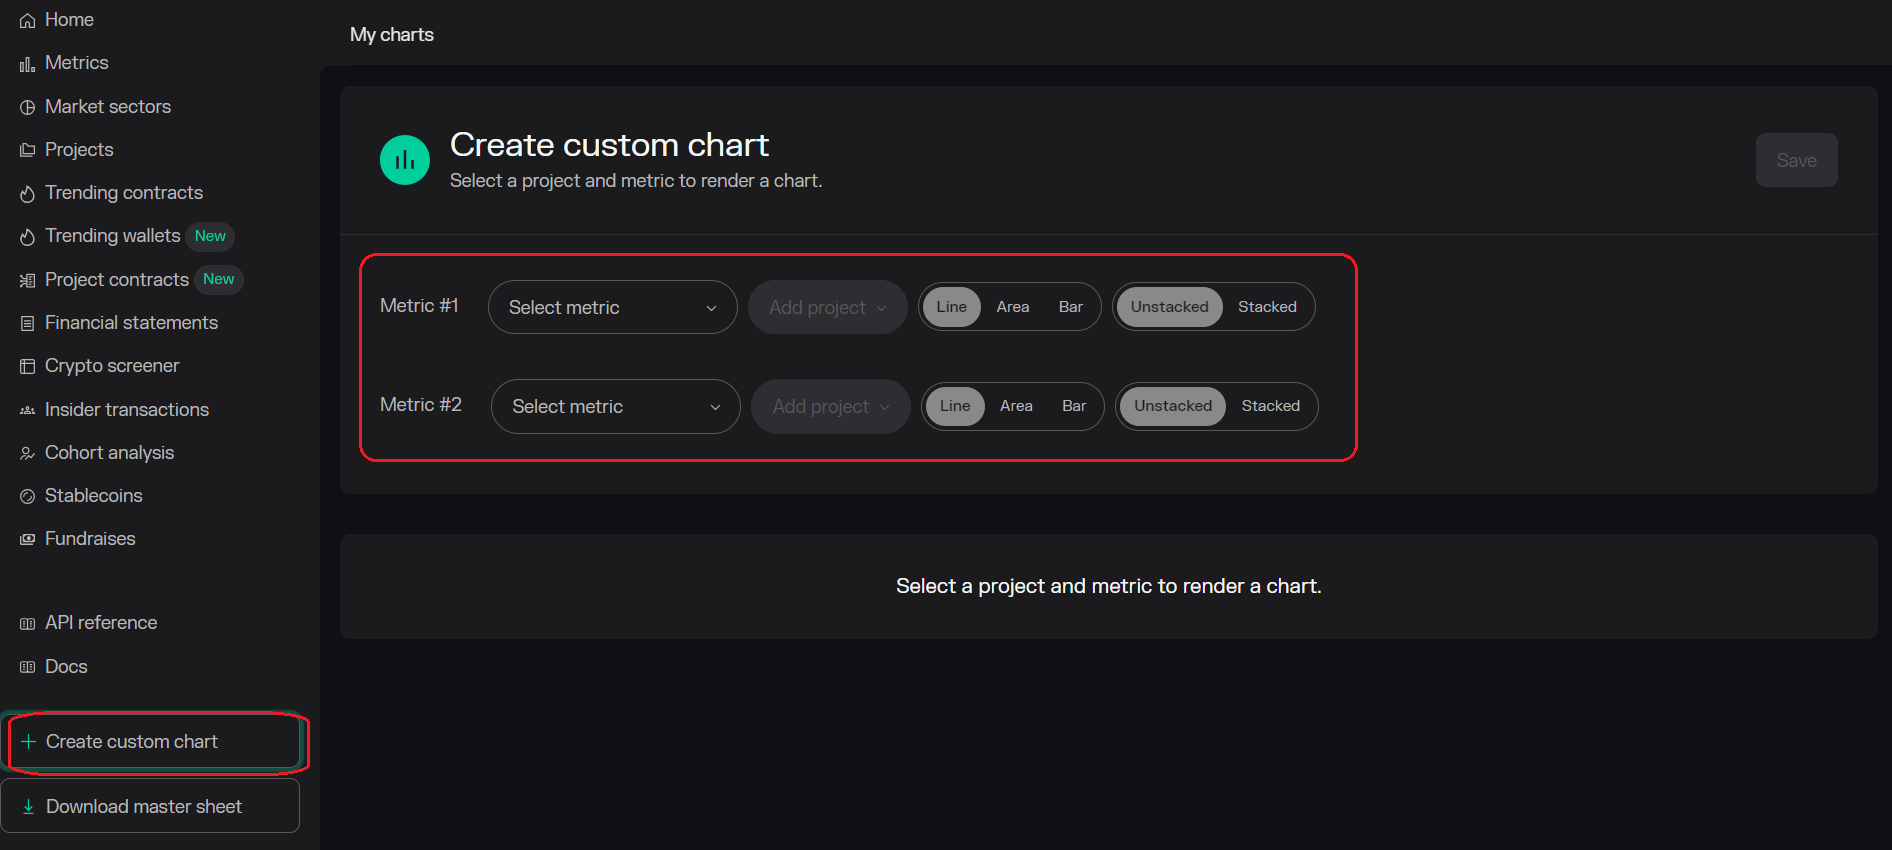
- Create a custom chart by selecting up to two metrics for any project.
Token Terminal Pro For Free
By registering with Token Terminal, you have free access to the Pro version for seven days! What I like about the platform’s trial is that it starts automatically without having to share any payment information.
FAQs
Token Terminal is a leading blockchain data analysis platform. It extracts open-source data from public blockchains and provides multiple metrics that can be visualized on charts.
You can analyze crypto market metrics and explore individual decentralized applications (dapps) and blockchains. The metrics can be visualized on interactive charts.
Token Terminal offers a wide range of metrics and analysis tools for free, with advanced features available for paid subscribers.
Yes – Token Terminal relies on its node infrastructure for data extraction, with all data being updated in real-time.
🍒 tasty reads


The Core Blockchain and DeFi Ecosystem: What You Need to Know

7 Best DePIN Crypto Projects

What Is Symbiotic and How Does It Work in 2024?
Ethereum vs Ethereum ETFs – 5 Major Differences


Anatol Antonovici
6+ years of experience writing for crypto brands and blockchain firms, including Coindesk, Cointelegraph, Bitcoinist, CryptoPotato, Algorand, and OTCTrade.com

