5 Best Technical Indicators for Crypto Trading in 2024
This article explores the 5 best technical indicators for crypto trading—Moving Average, RSI, MACD, Bollinger Bands, and Fibonacci Retracement—emphasizing their combination for stronger signals and diverse uses in market trend analysis.
Technical indicators are mathematical computations derived from asset prices, volume, or open interest. In this article, we discuss the 5 best indicators forcrypto trading.
Table of Contents
🍒 tasty takeaways
Cryptocurrency traders use technical indicators borrowed from traditional markets, e.g., stocks and forex.
The golden rule for using technical indicators is combining them to confirm stronger signals.
There are four primary types of indicators:
Trendindicators(MA, MACD)
Momentumindicators(RSI, Stochastic)
Volatilityindicators (BB)
Volumeindicators(OBV)
Summary
Indicator
Description
Pros
Cons
Moving Average (MA)
Averages closing price over a set period; helps determine trends.
Identifies support/resistance, useful in any market condition.
Requires experience, involves subjectivity.
1. Moving Average
Averages closing prices over set periods, smoothing volatility
Popular in identifying market trends, used as dynamic support/resistance
Includes variations like EMA for recent price emphasis; lagging nature limits effectiveness in market shocks
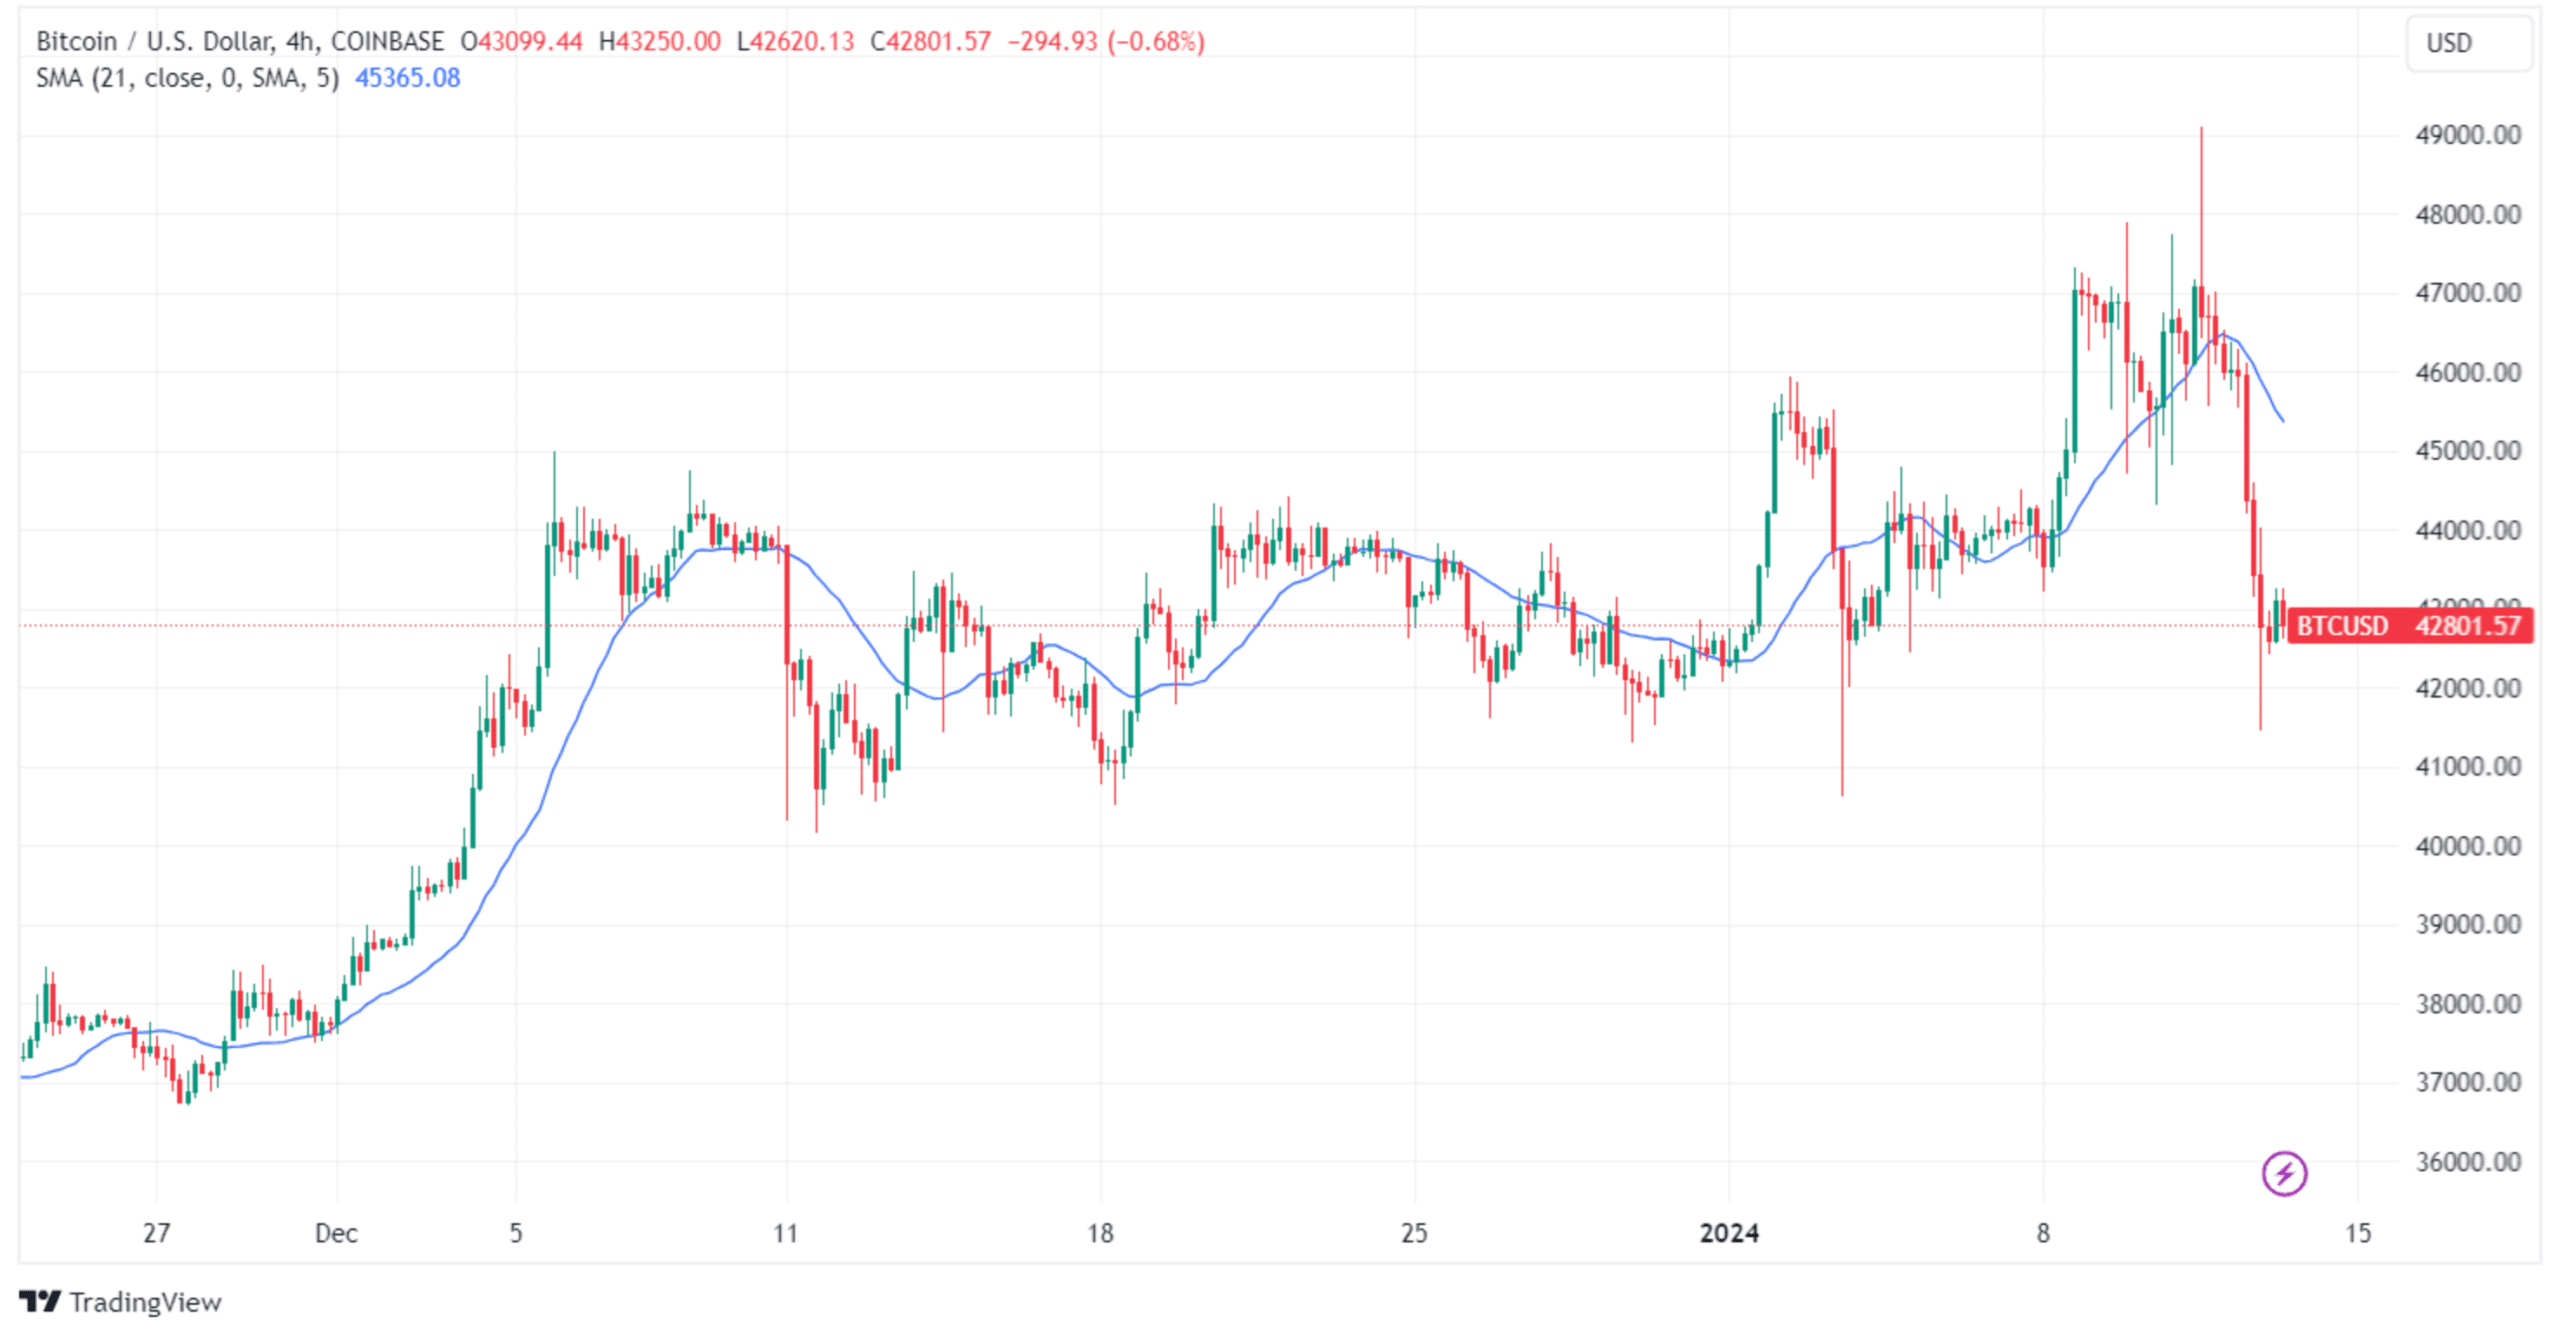
The moving average (MA) is the most common and oldest indicator. By default, the MA is the average close price of a crypto asset during the last “x” number of periods, e.g., hours, days, weeks.
For example, a 20-day MA shows the average closing price during the last 20 days. You can customize the indicator by replacing the closing price with the open price, high or low.
Here is what a moving average looks like on a chart:
MAs help crypto traders determine the general trend by smoothing out volatility.
There are several types of MAs. For example, the exponential moving average (EMA) gives more importance to the last price changes within the tracked period.
Golden Cross/Death Cross – when a shorter MA (usually a 50-period one) crosses above a longer MA (such as a 200-period one), we call it a Golden Cross. This usually signals the formation of a long-term bullish trend. When the shorter MA crosses below the longer MA, we expect a long-term downtrend.
Support/resistance – the MA can be used as the support or resistance level for the price action.
Pros
Useful for determining the general market trend.
Works well as a dynamic resistance and support level.
The indicator is lagging, leading to late entry and exit point signals.
It becomes irrelevant during market shocks.
It doesn’t work when the price moves within a horizontal channel.
🍒 Professional investors use both technical and fundamental research. Learn here about the best free Crypto Fundamental Analysis Tools.
2. Relative Strength Index (RSI)
Momentum oscillator fluctuating between 0 and 100
Identifies overbought (>70) or oversold (<30) conditions, potential for trend reversals
Effective in trend strength assessment; less reliable in strong trending or sideways markets
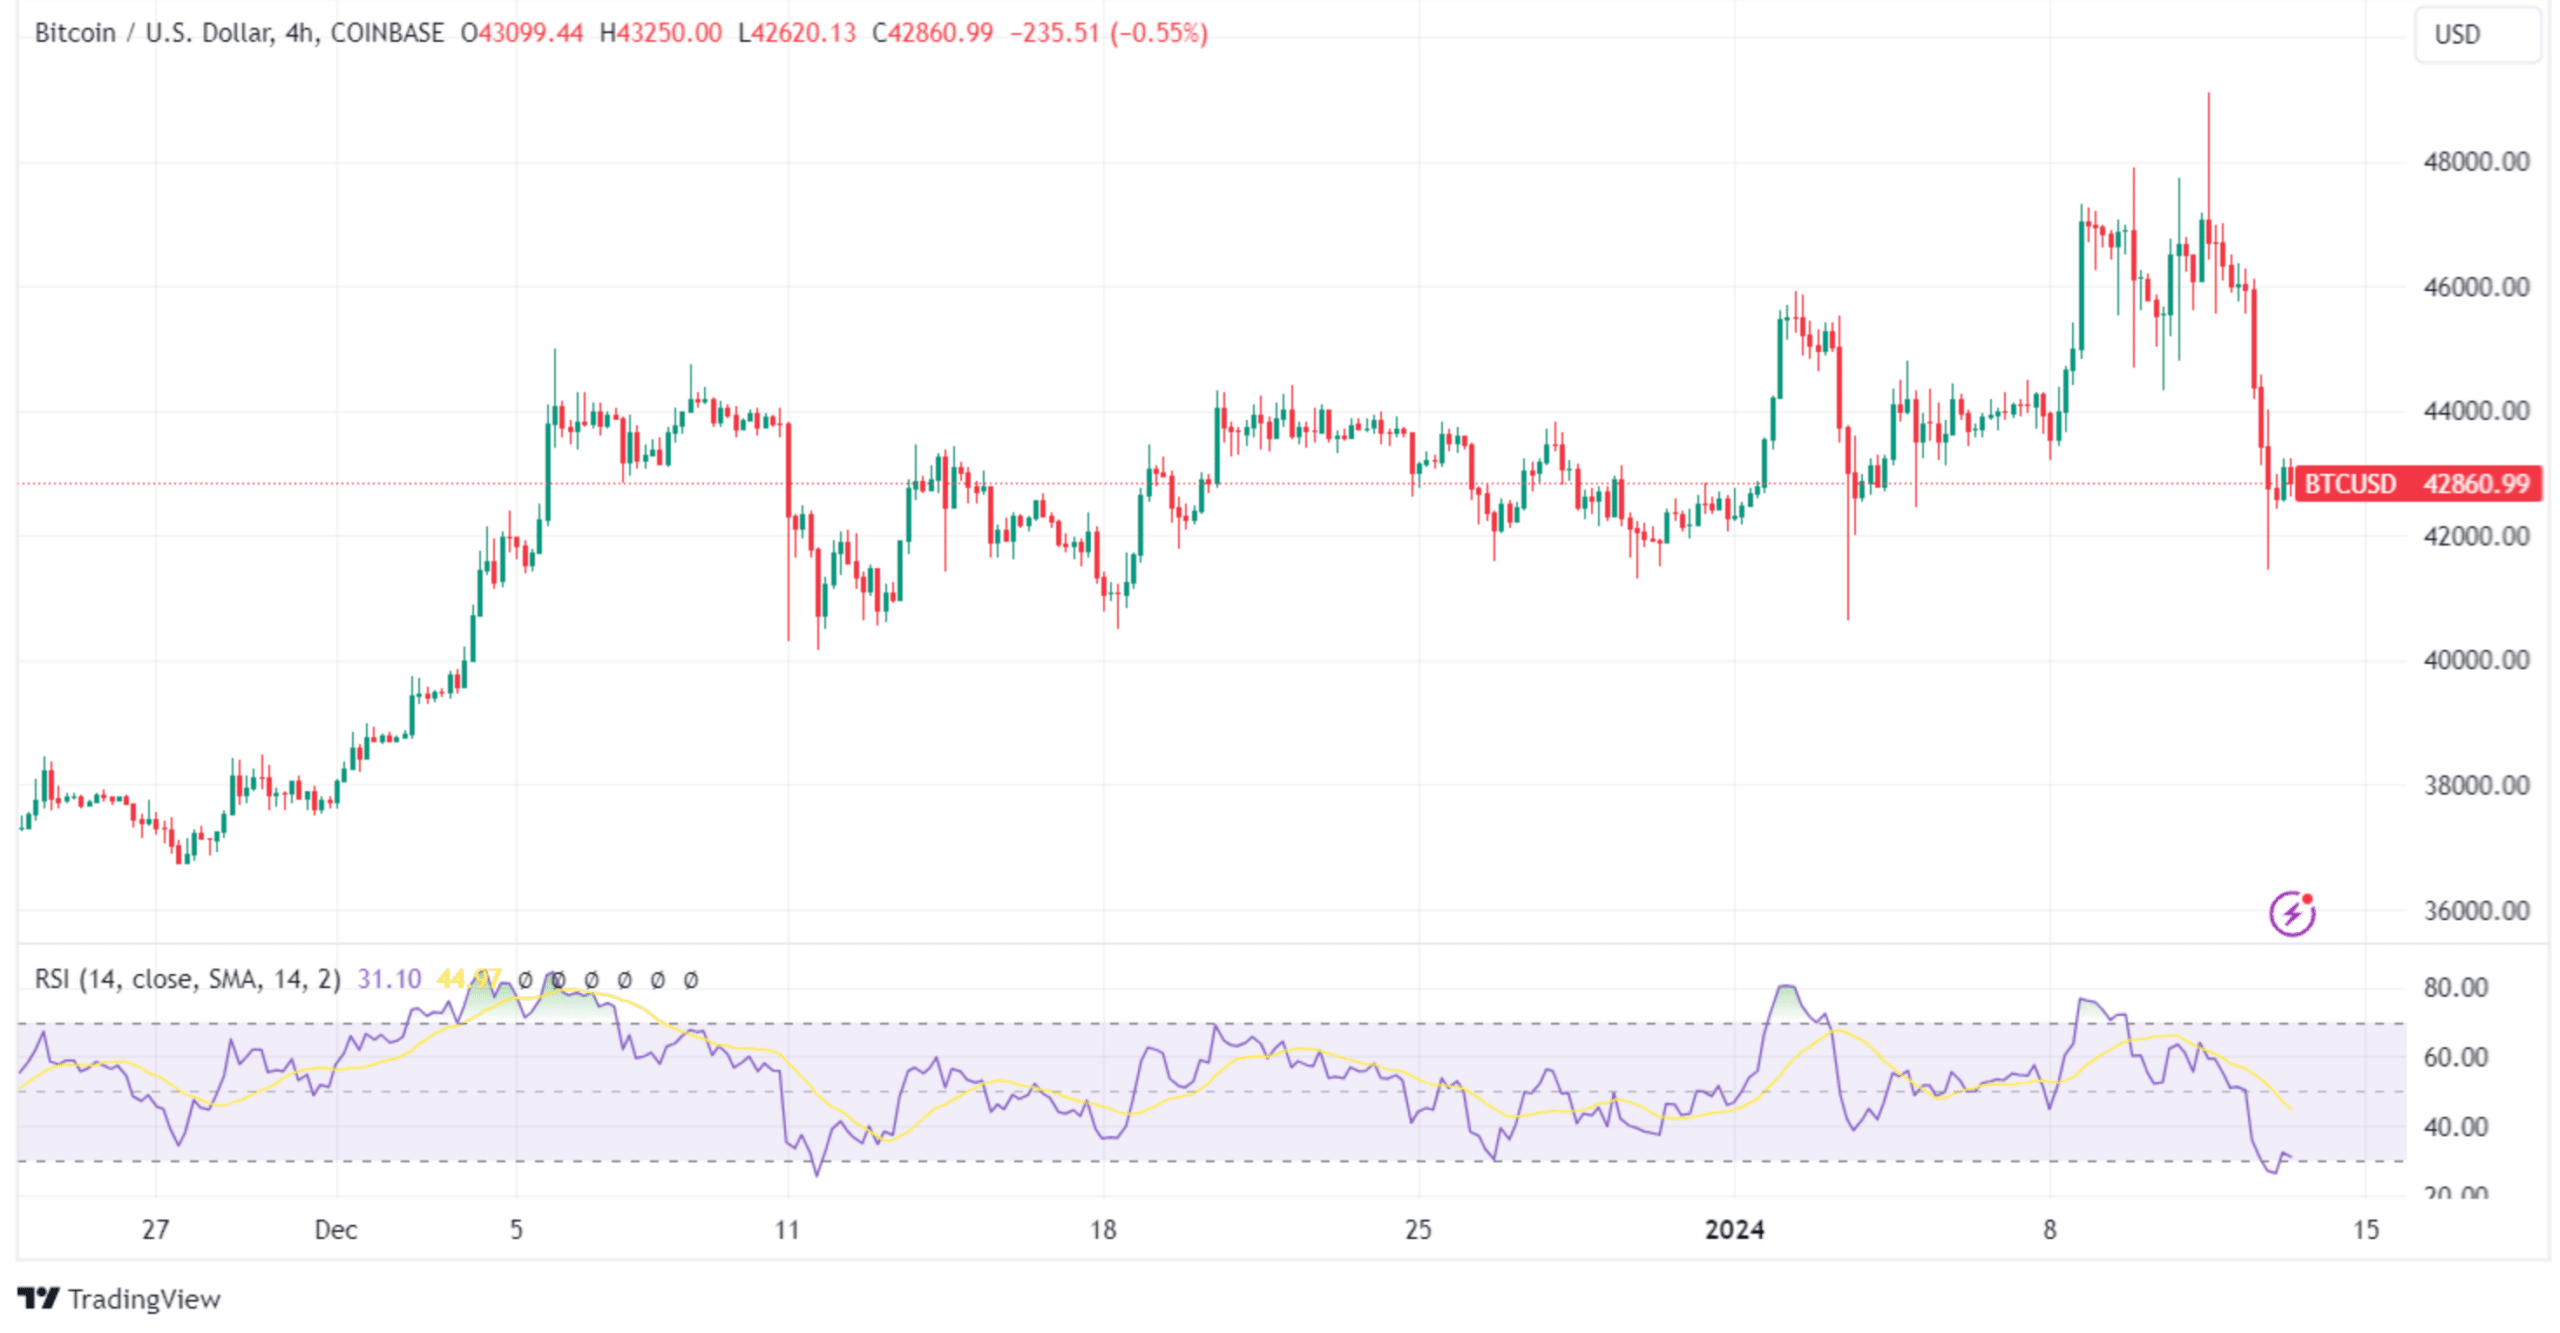
The Relative Strength Index (RSI) is a momentum oscillator that measures the magnitude of the latest price change, helping investors assess overbought and oversold conditions.
On a chart, the RSI is an oscillator that fluctuates between 0 and 100.
By default, the indicator measures the latest changes in the crypto price over 14 periods. It divides the average gain of the price over that period by the average loss.
Overbought/oversold levels – if the RSI is above 70, then a market is in the overbought zone, and a potential trend reversal might occur. If the RSI is below 30, then the market is oversold. Crypto traders buy oversold and sell overbought crypto.
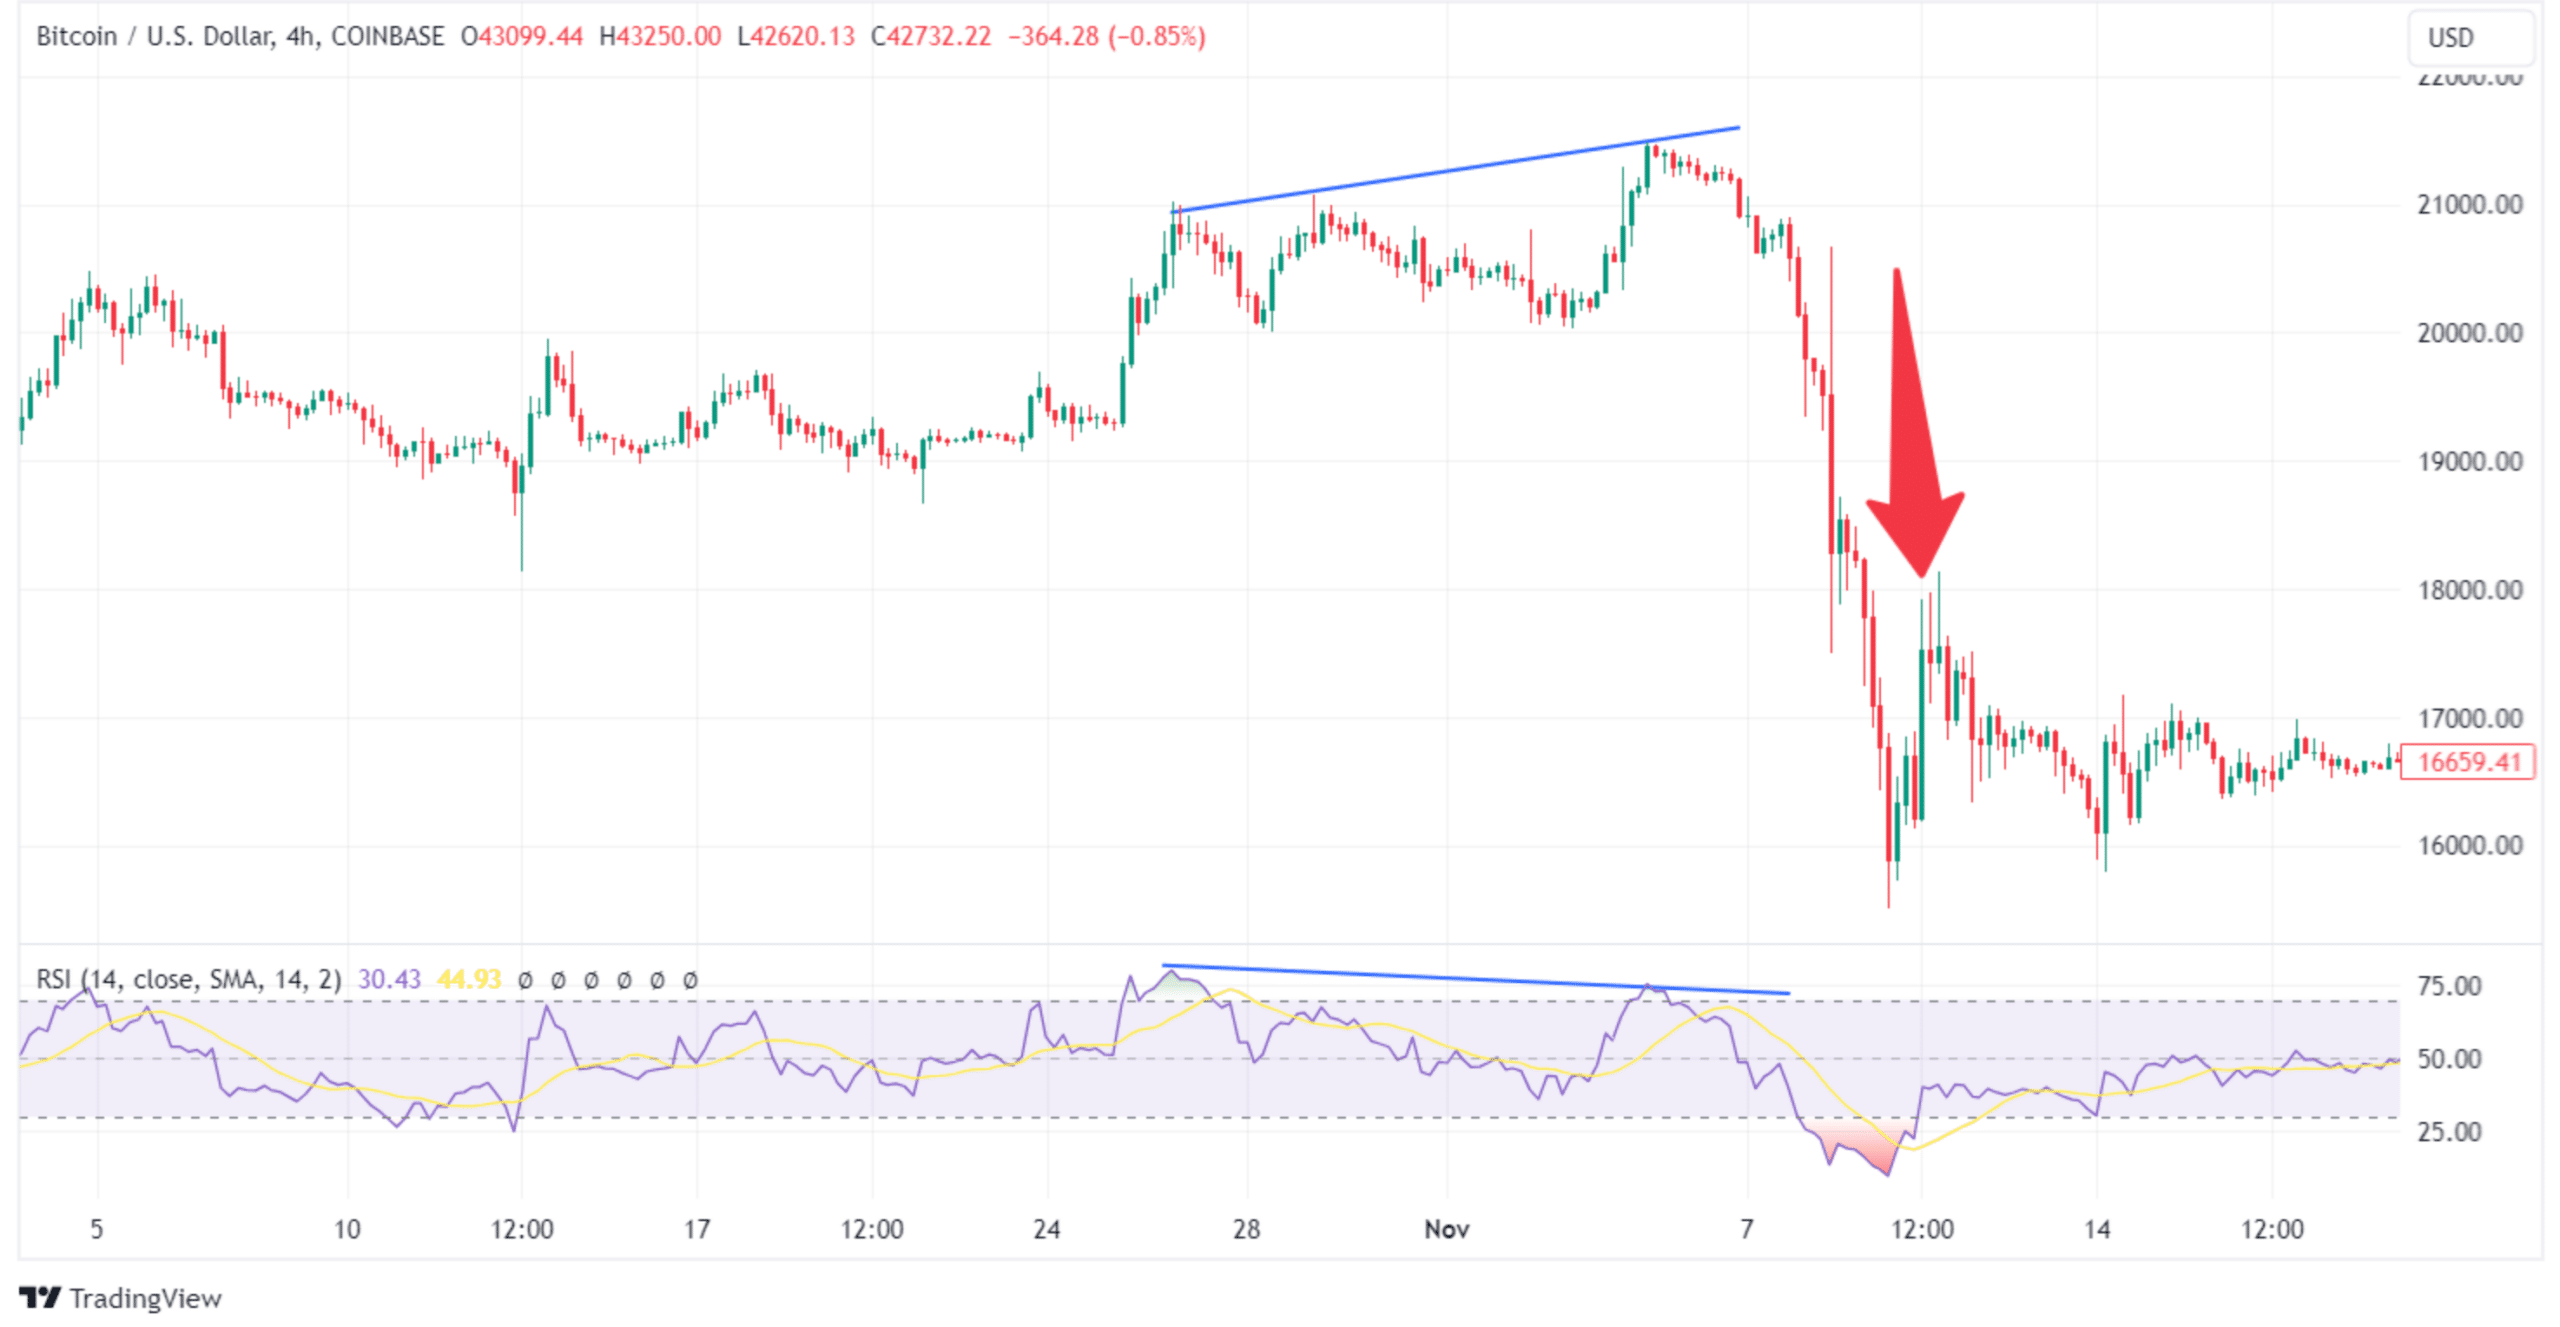
Divergence – when the price and the RSI show divergence – e.g., the price goes up while the RSI goes down – you may expect a trend reversal
The RSI is a good tool to identify overbought and oversold levels.
Crypto traders can use the RSI to identify the strength of a trend.
Cons
In strong trending markets, the RSI can provide false signals by remaining in the overbought or oversold levels for extended periods.
The RSI doesn’t work well in sideways or consolidating markets. In these situations, the Stochastic oscillator is more suitable. Stochastic can used similarly, but it works differently and it uses 80 and 20 levels for overbought and oversold levels.
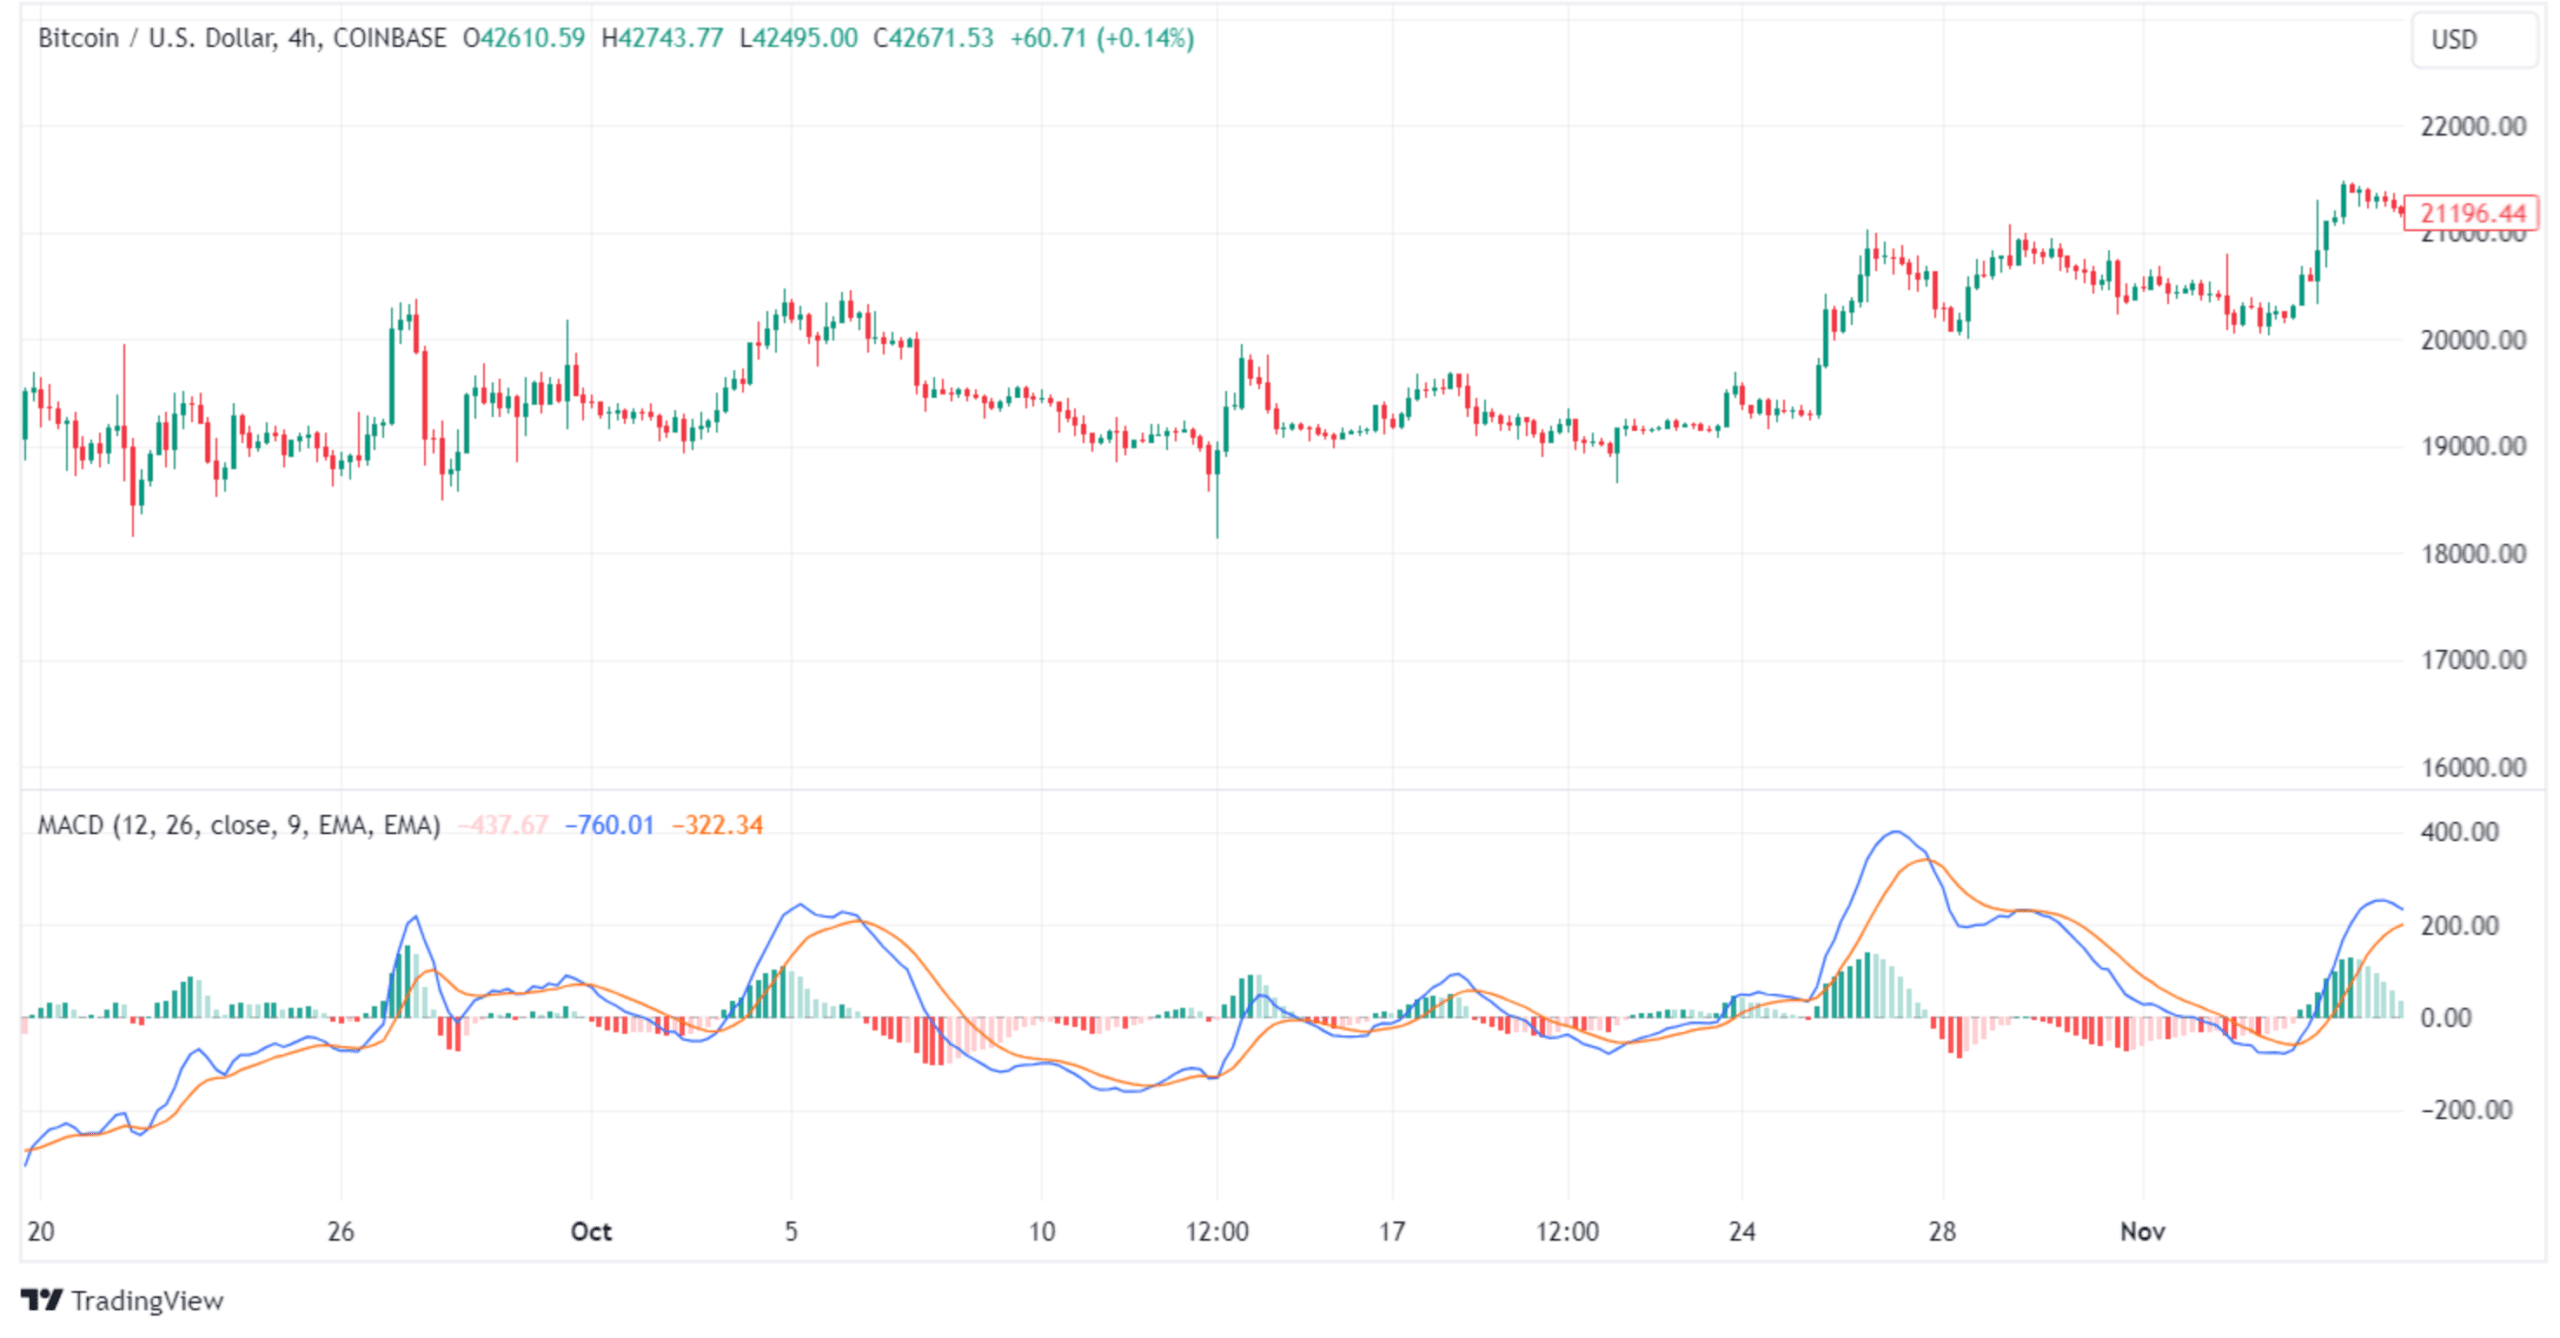
The MACD line – represents the distance between two EMAs by subtracting the 26-period EMA from the 12-period EMA.
The Signal line – represents a 9-period EMA of the MACD line itself. It is plotted on the MACD line and acts as a trigger, signaling crypto traders about the changes in momentum.
Histogram – represents the difference between the MACD line and the signal line.
MACD crossover – when the MACD (on TradingView, it’s the blue line) crosses the signal line from bottom to top, crypto traders open long positions. A bearish signal is valid when the MACD crosses below the signal line.
Histogram – when the histogram is increasing in either direction, it signals the existing trend is gaining momentum.
MACD divergences – MACD can form divergences with the price action and can be used the same way as the RSI.
Pros
MACD acts both as a momentum and trend-following indicator.
MACD can be used to find divergences in the price, which are powerful signals.
Cons
Since it relies on MAs, the indicator can lag behind the current price.
MACD is more complex for beginners.
MACD often provides false signals during sideways (neutral) markets.
Volatility indicator with three lines forming a price-enveloping band
Widens during high volatility, narrows during low volatility
Effective in both trending and low-volatility markets; relies on moving averages
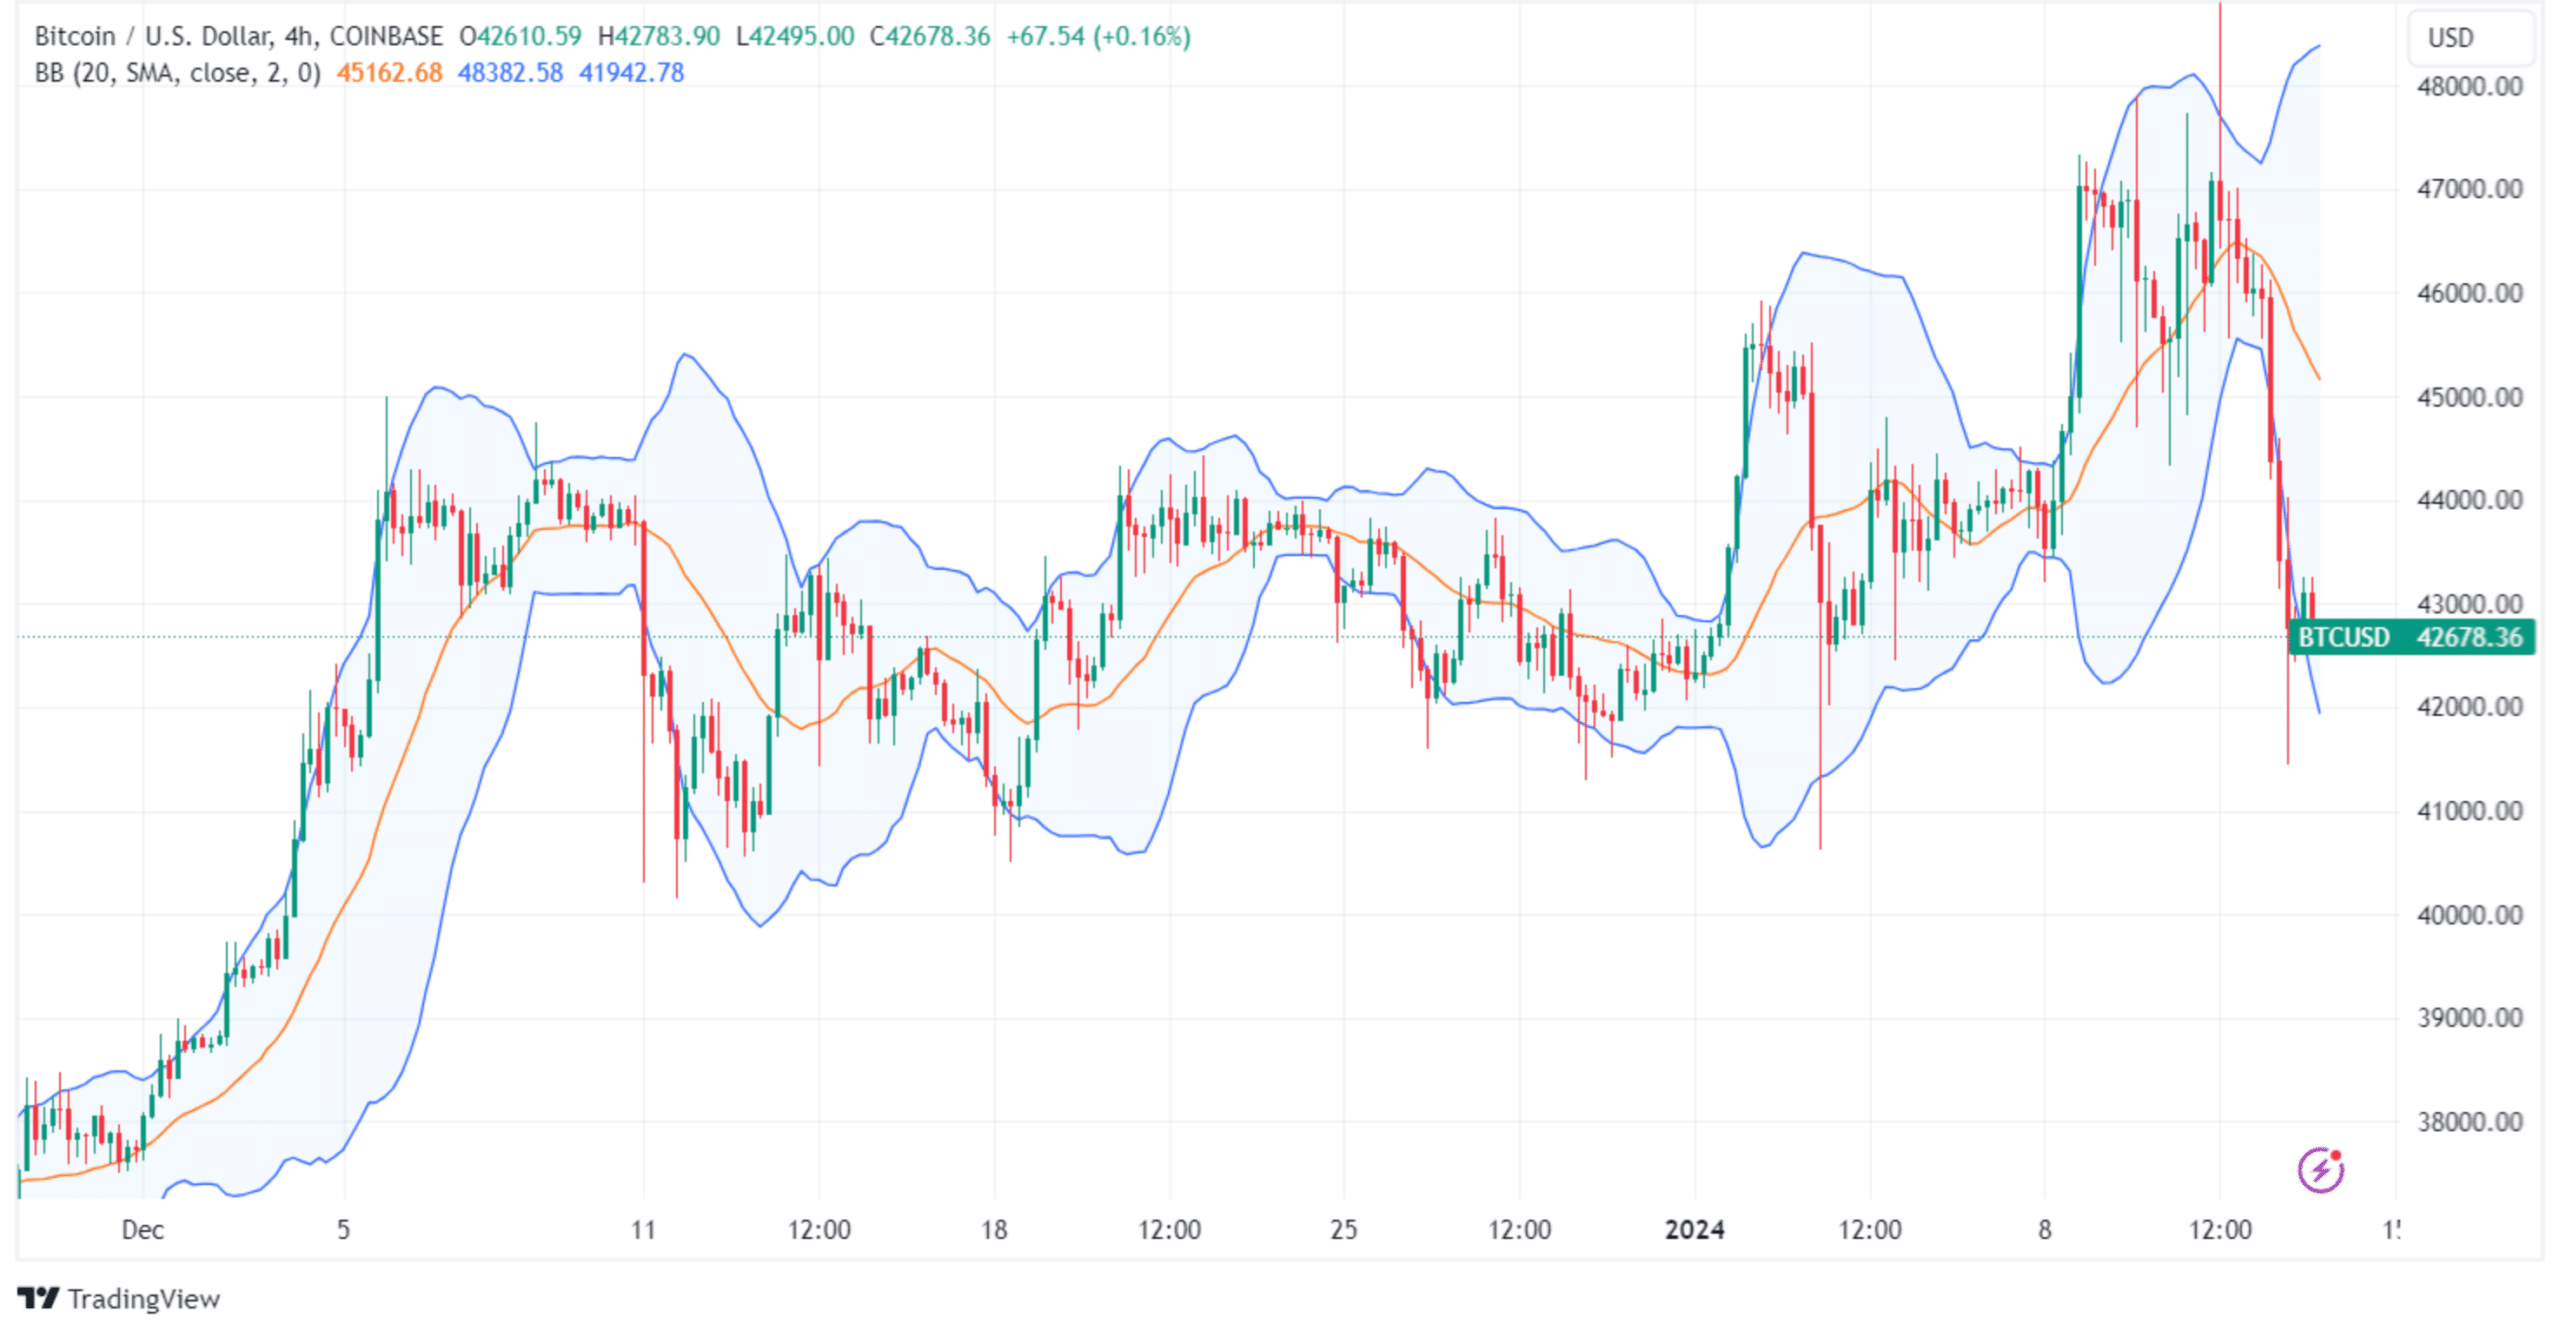
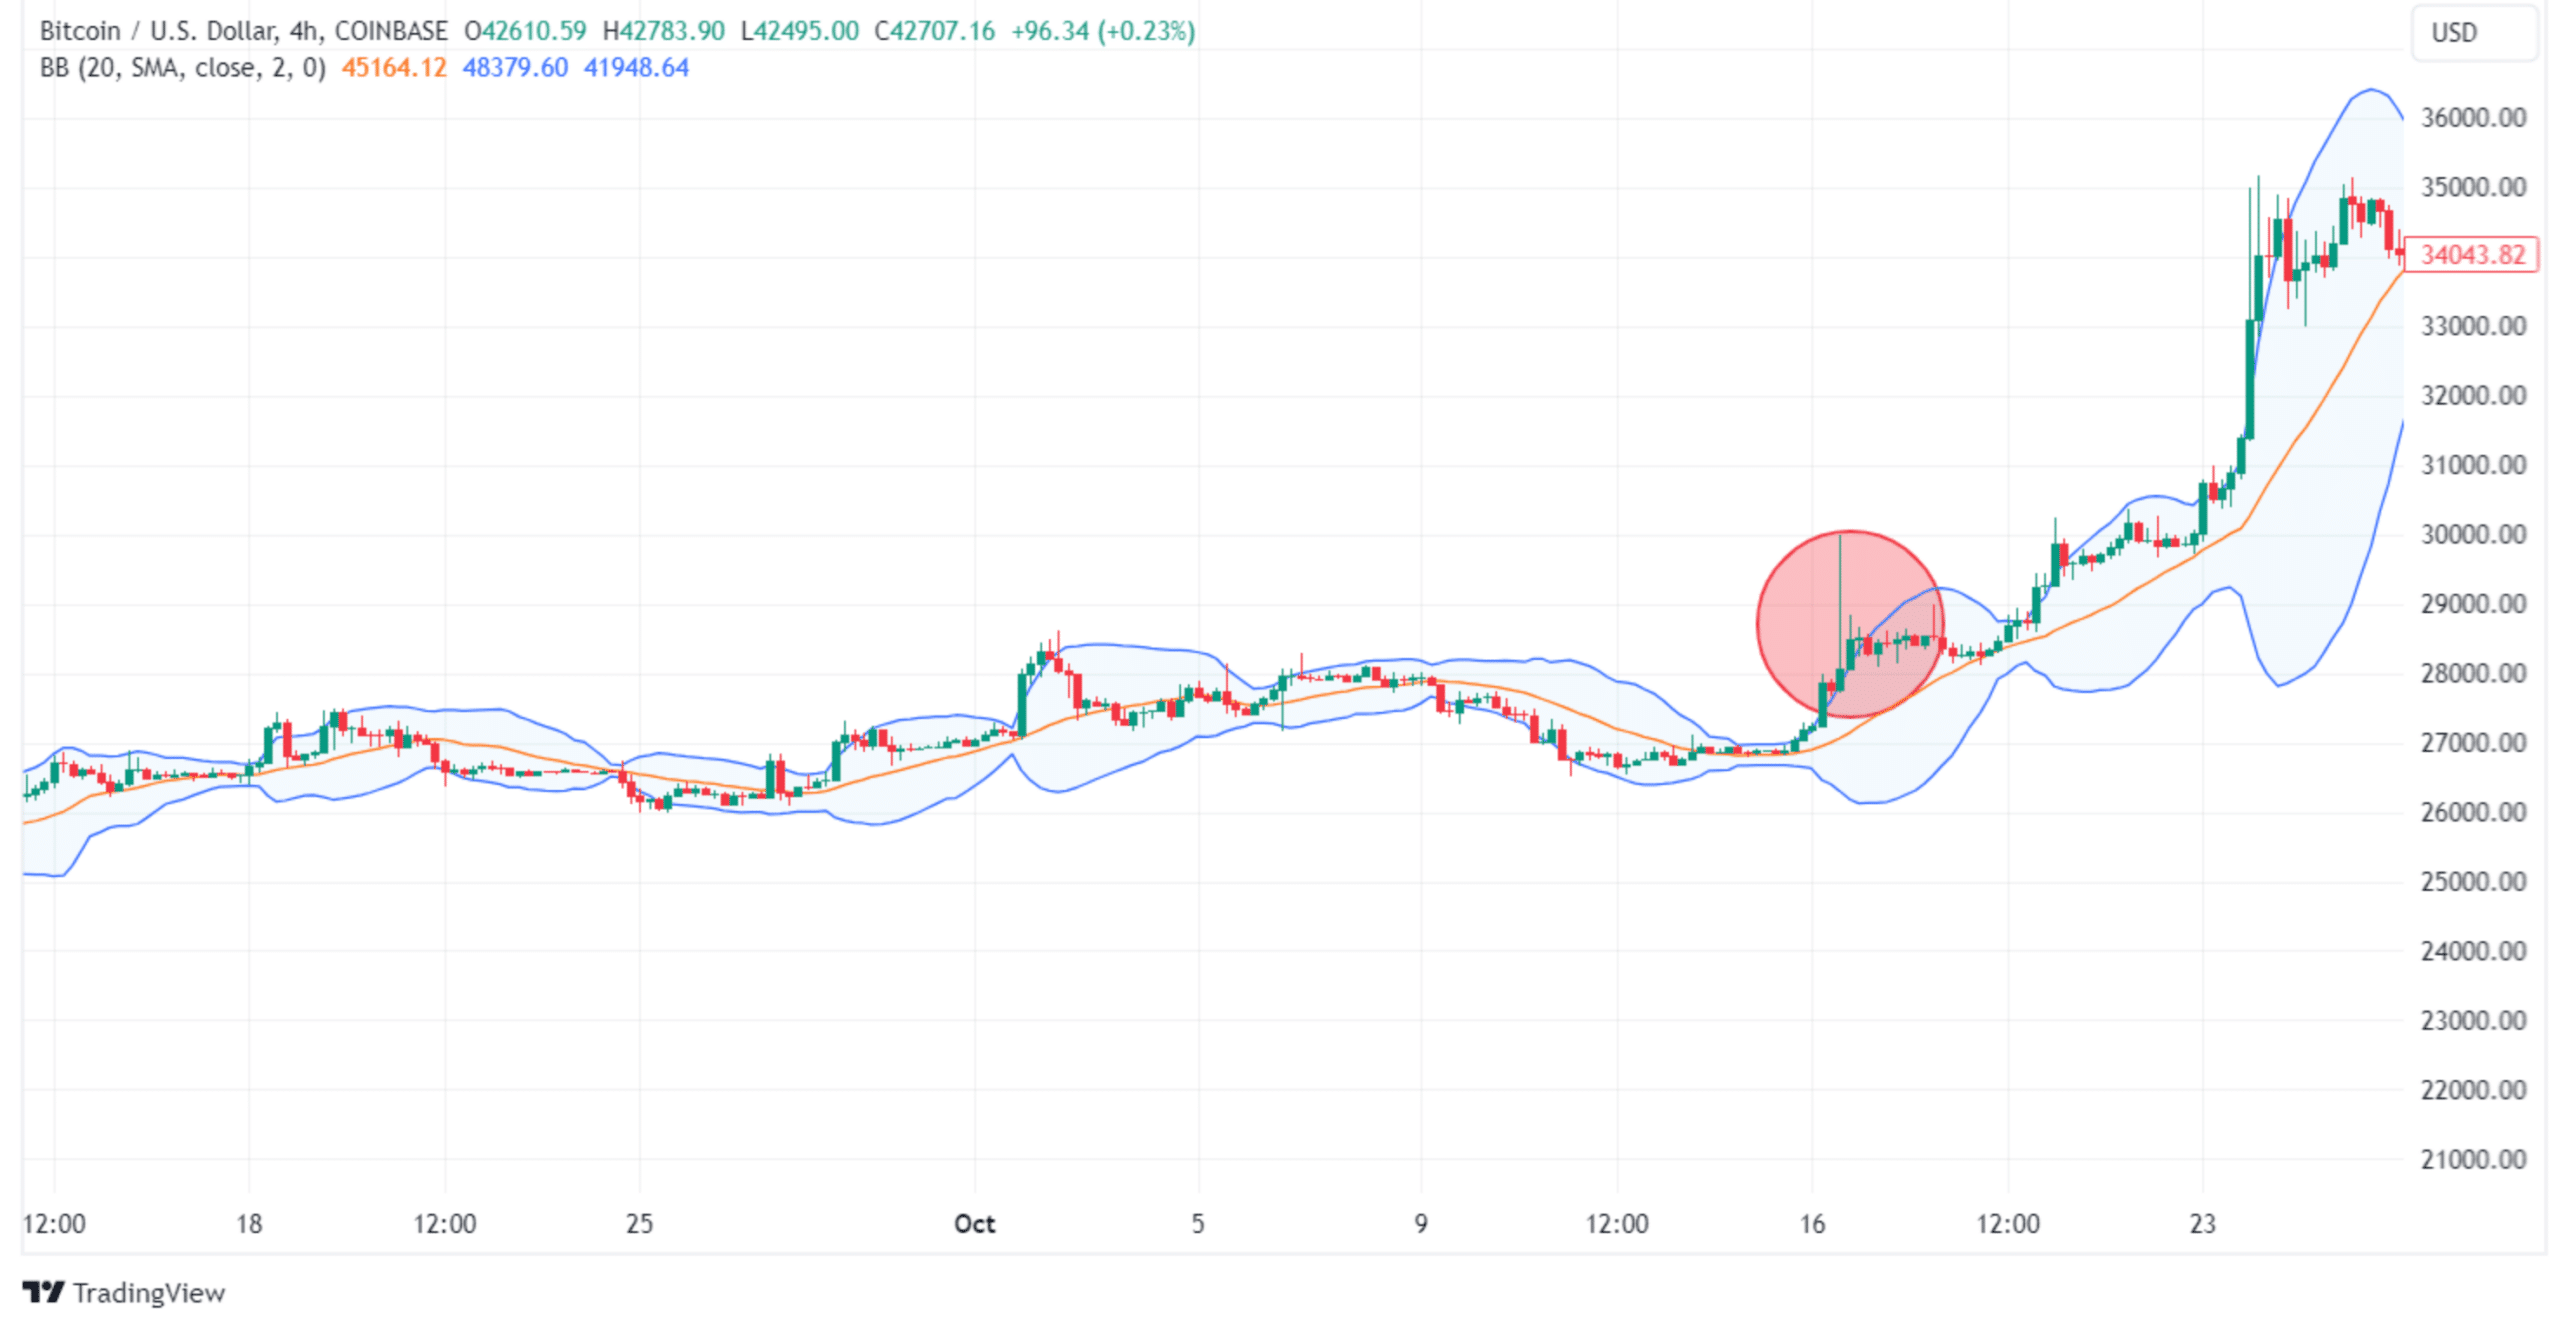
Bollinger Bands (BB) represent a volatility indicator, which makes it relevant for crypto traders. The indicator is made up of three lines, forming an envelope that engulfs the price and moves with it.
By default, the middle line represents a 20-period simple moving average (SMA), while the upper and lower bands represent two standard deviations from the middle line. The distance between the upper and lower lines widens during market volatility.
Bollinger bounce – this is a short-term reversal strategy based on the premise that the price tends to pull back to the middle line whenever it touches one of the extremes. Therefore, when the price hits the upper band, crypto traders would go short, and vice versa.
Bollinger squeeze – this is a great strategy when the price shows low volatility. When the bands squeeze together, be ready for a breakout in either direction. If the price breaks above the upper band, you can open long positions, and vice versa.
Plots horizontal lines at key Fibonacci ratios for support/resistance levels
Effective across various market conditions and timeframes
Requires experience, subject to market psychology and interpretation
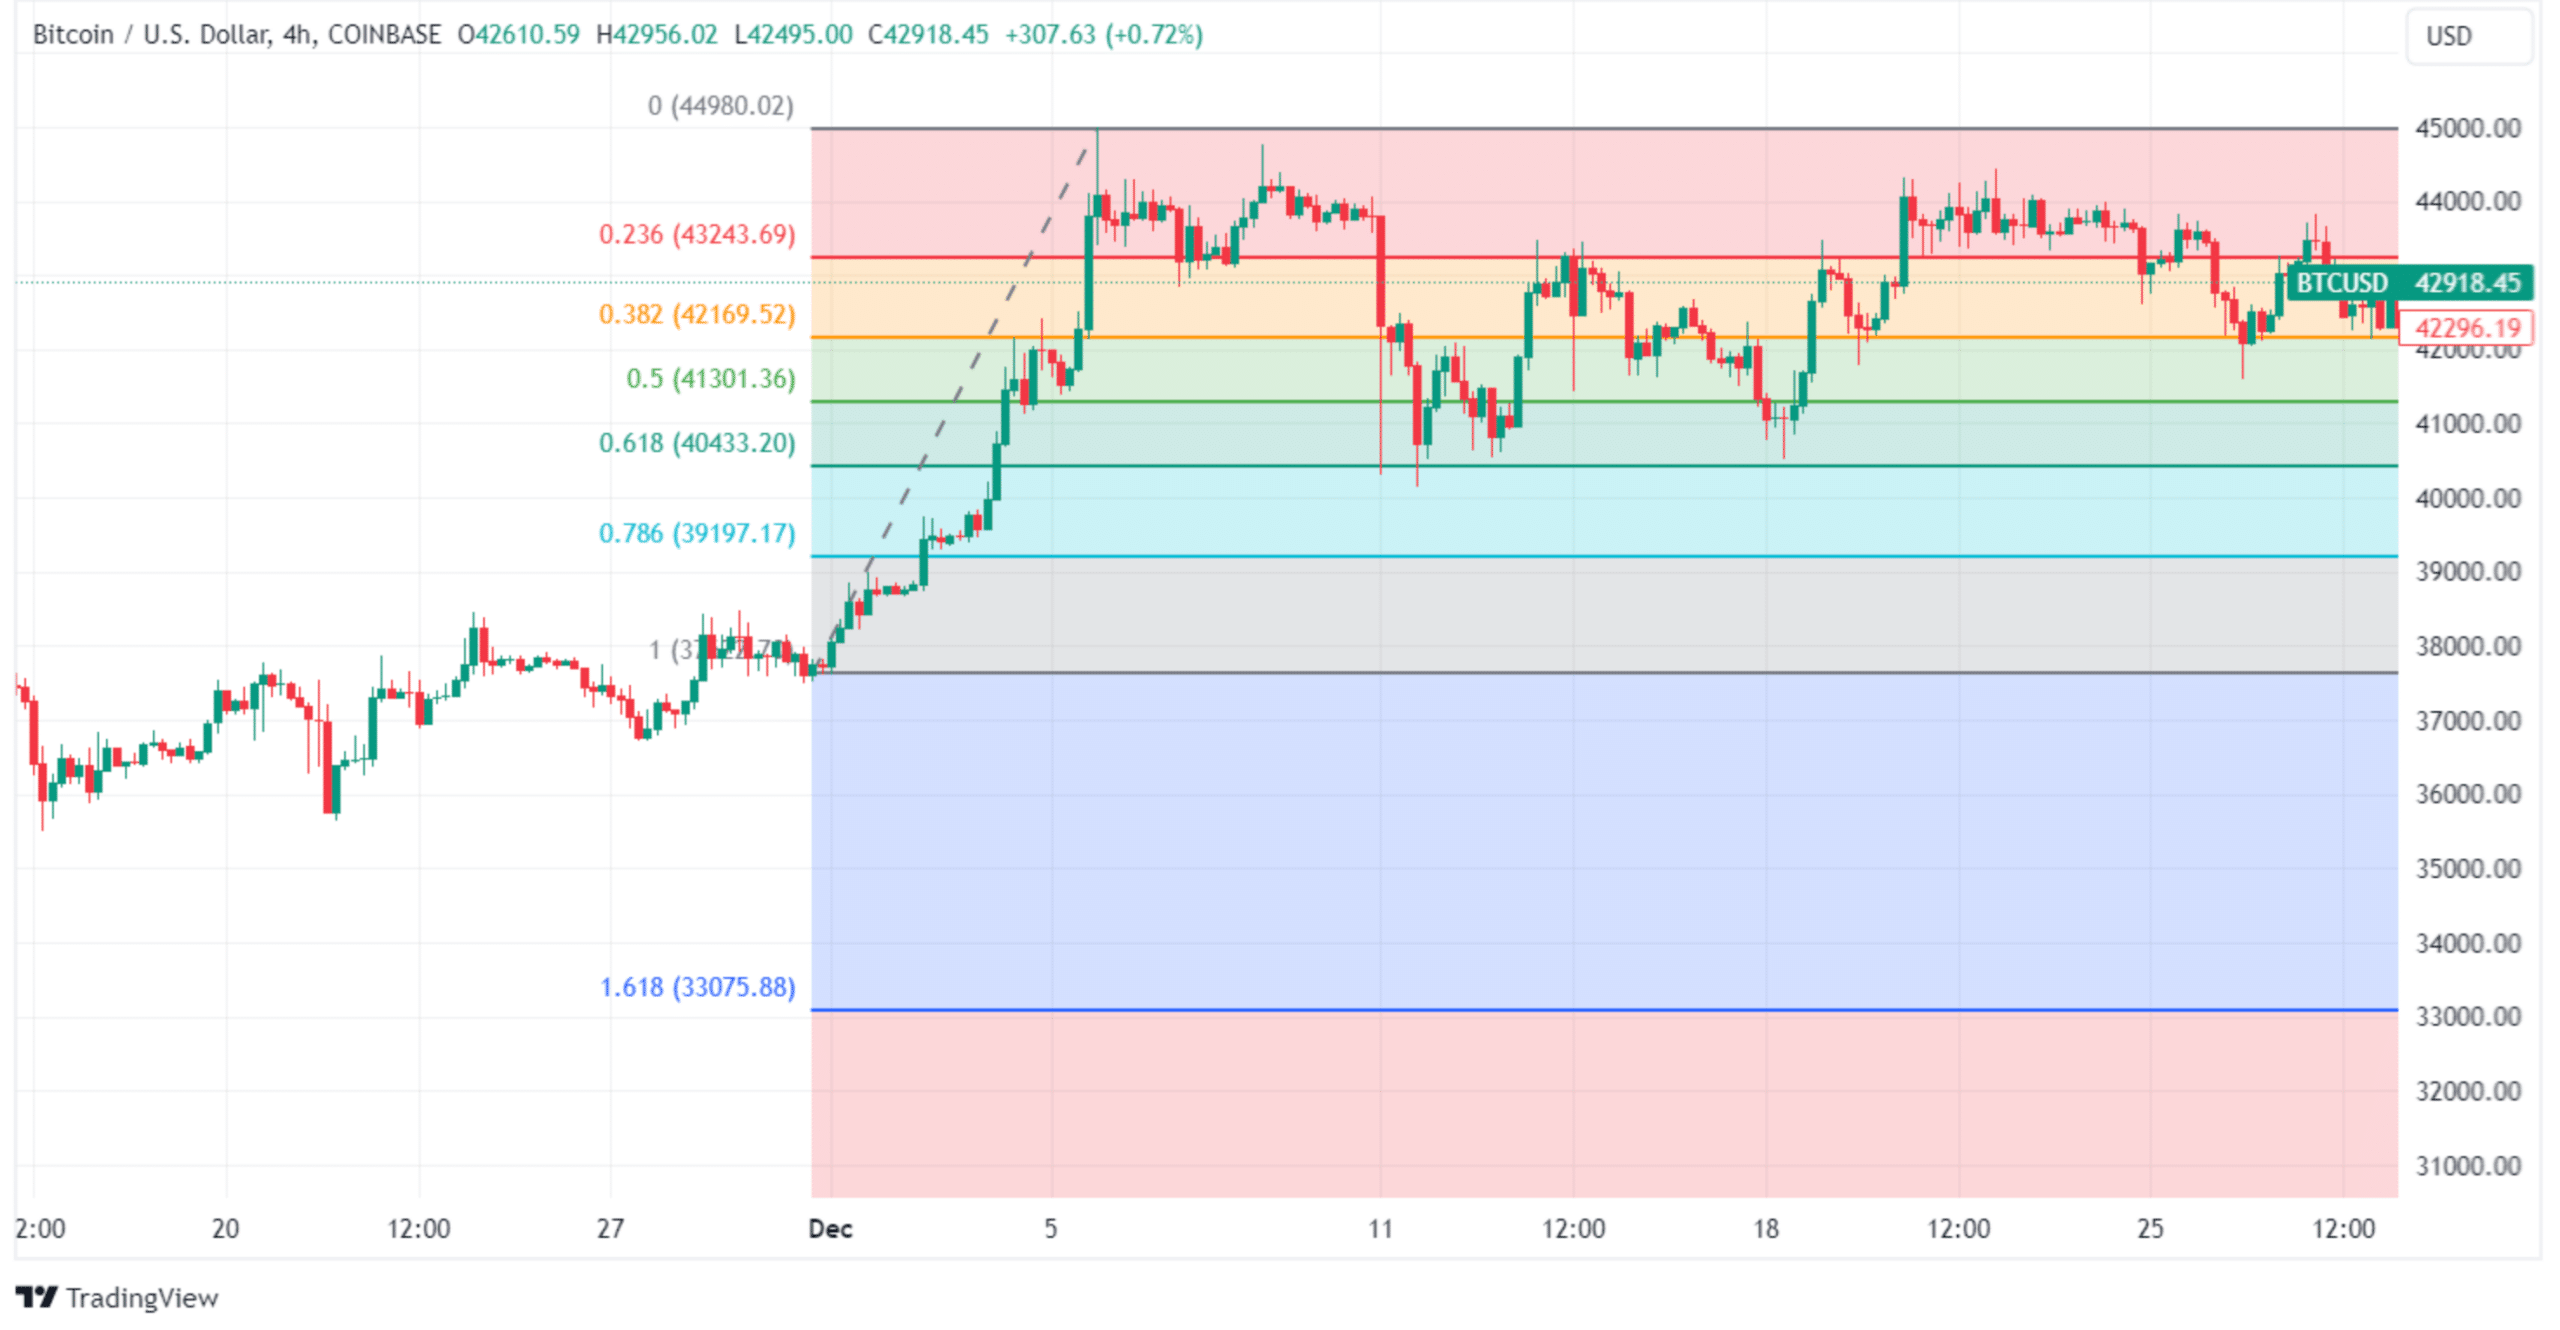
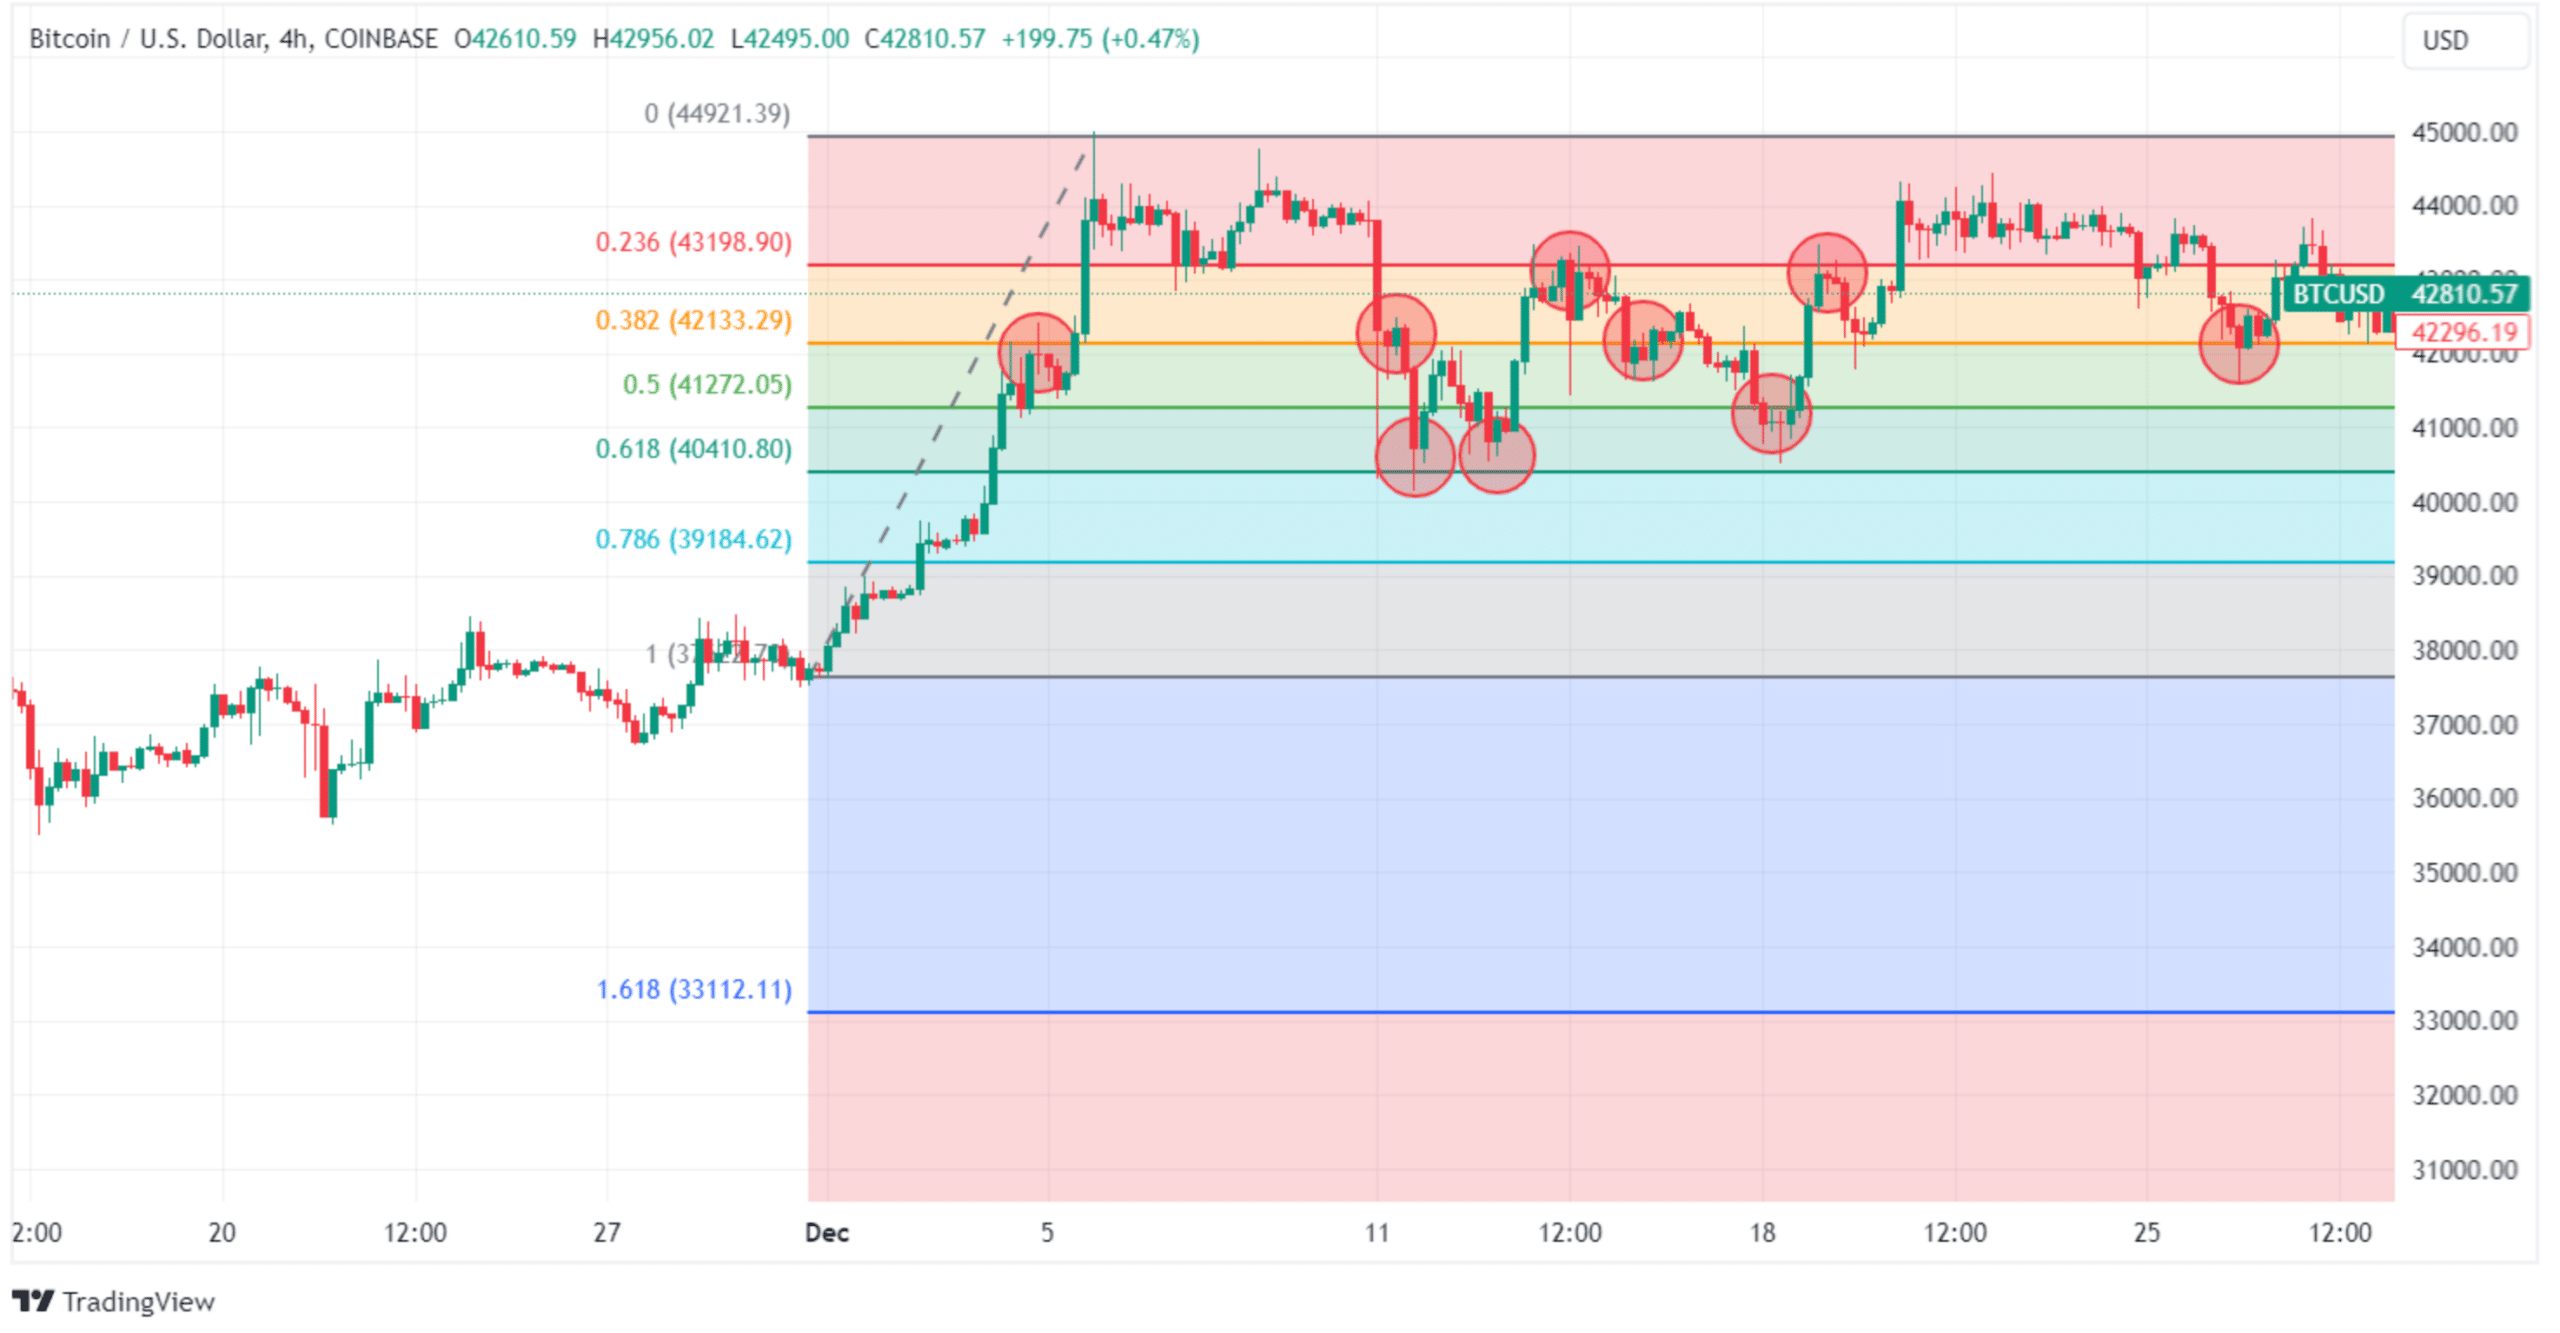
Fibonacci retracement is an indicator representing multiple horizontal lines plotted on the price chart, usually between a swing high and a swing low. Crypto traders use these lines to get hints about where the potential support and resistance may be.
Each level of the indicator is associated with a percentage that derives from the popular Fibonacci sequence. Therefore, the retracement levels are 23.6%, 38.2%, 61.8%, and 78.6%. 50% is also added even though it’s not part of the sequence.
The indicator provides a simple way to identify potential support and resistance levels, anticipating price reversals. As a rule, Fibonacci is used in combination with other indicators.
Pros
It can effectively identify potential support and resistance levels, being useful in risk management.
It works in any market conditions and with any timeframe.
Cons
Using Fibonacci retracement requires some experience.
The indicator involves some subjectivity, with some investors arguing that it shouldn’t influence trading decisions. Nevertheless, since everyone uses it, many traders expect the same thing to happen near one of the levels, so market psychology makes it relevant.
When you store your crypto in a self-custody wallet, you don’t have to trust that an exchange is acting in your best interest. This is because you are the only party privy to your private key, or seed phrase.
Here are some additional benefits you get when you choose to self-custody your digital assets with tastycrypto:
In-App Swap: Trade BTC, ETH, and 1,000+ tokens
Generate Yield in DeFi: Stake, lend, and become your own market maker
NFTs: Buy, sell, and view NFTs in-app
tastycrypto offers both iOS and Android self-custody wallets – download yours today! 👇
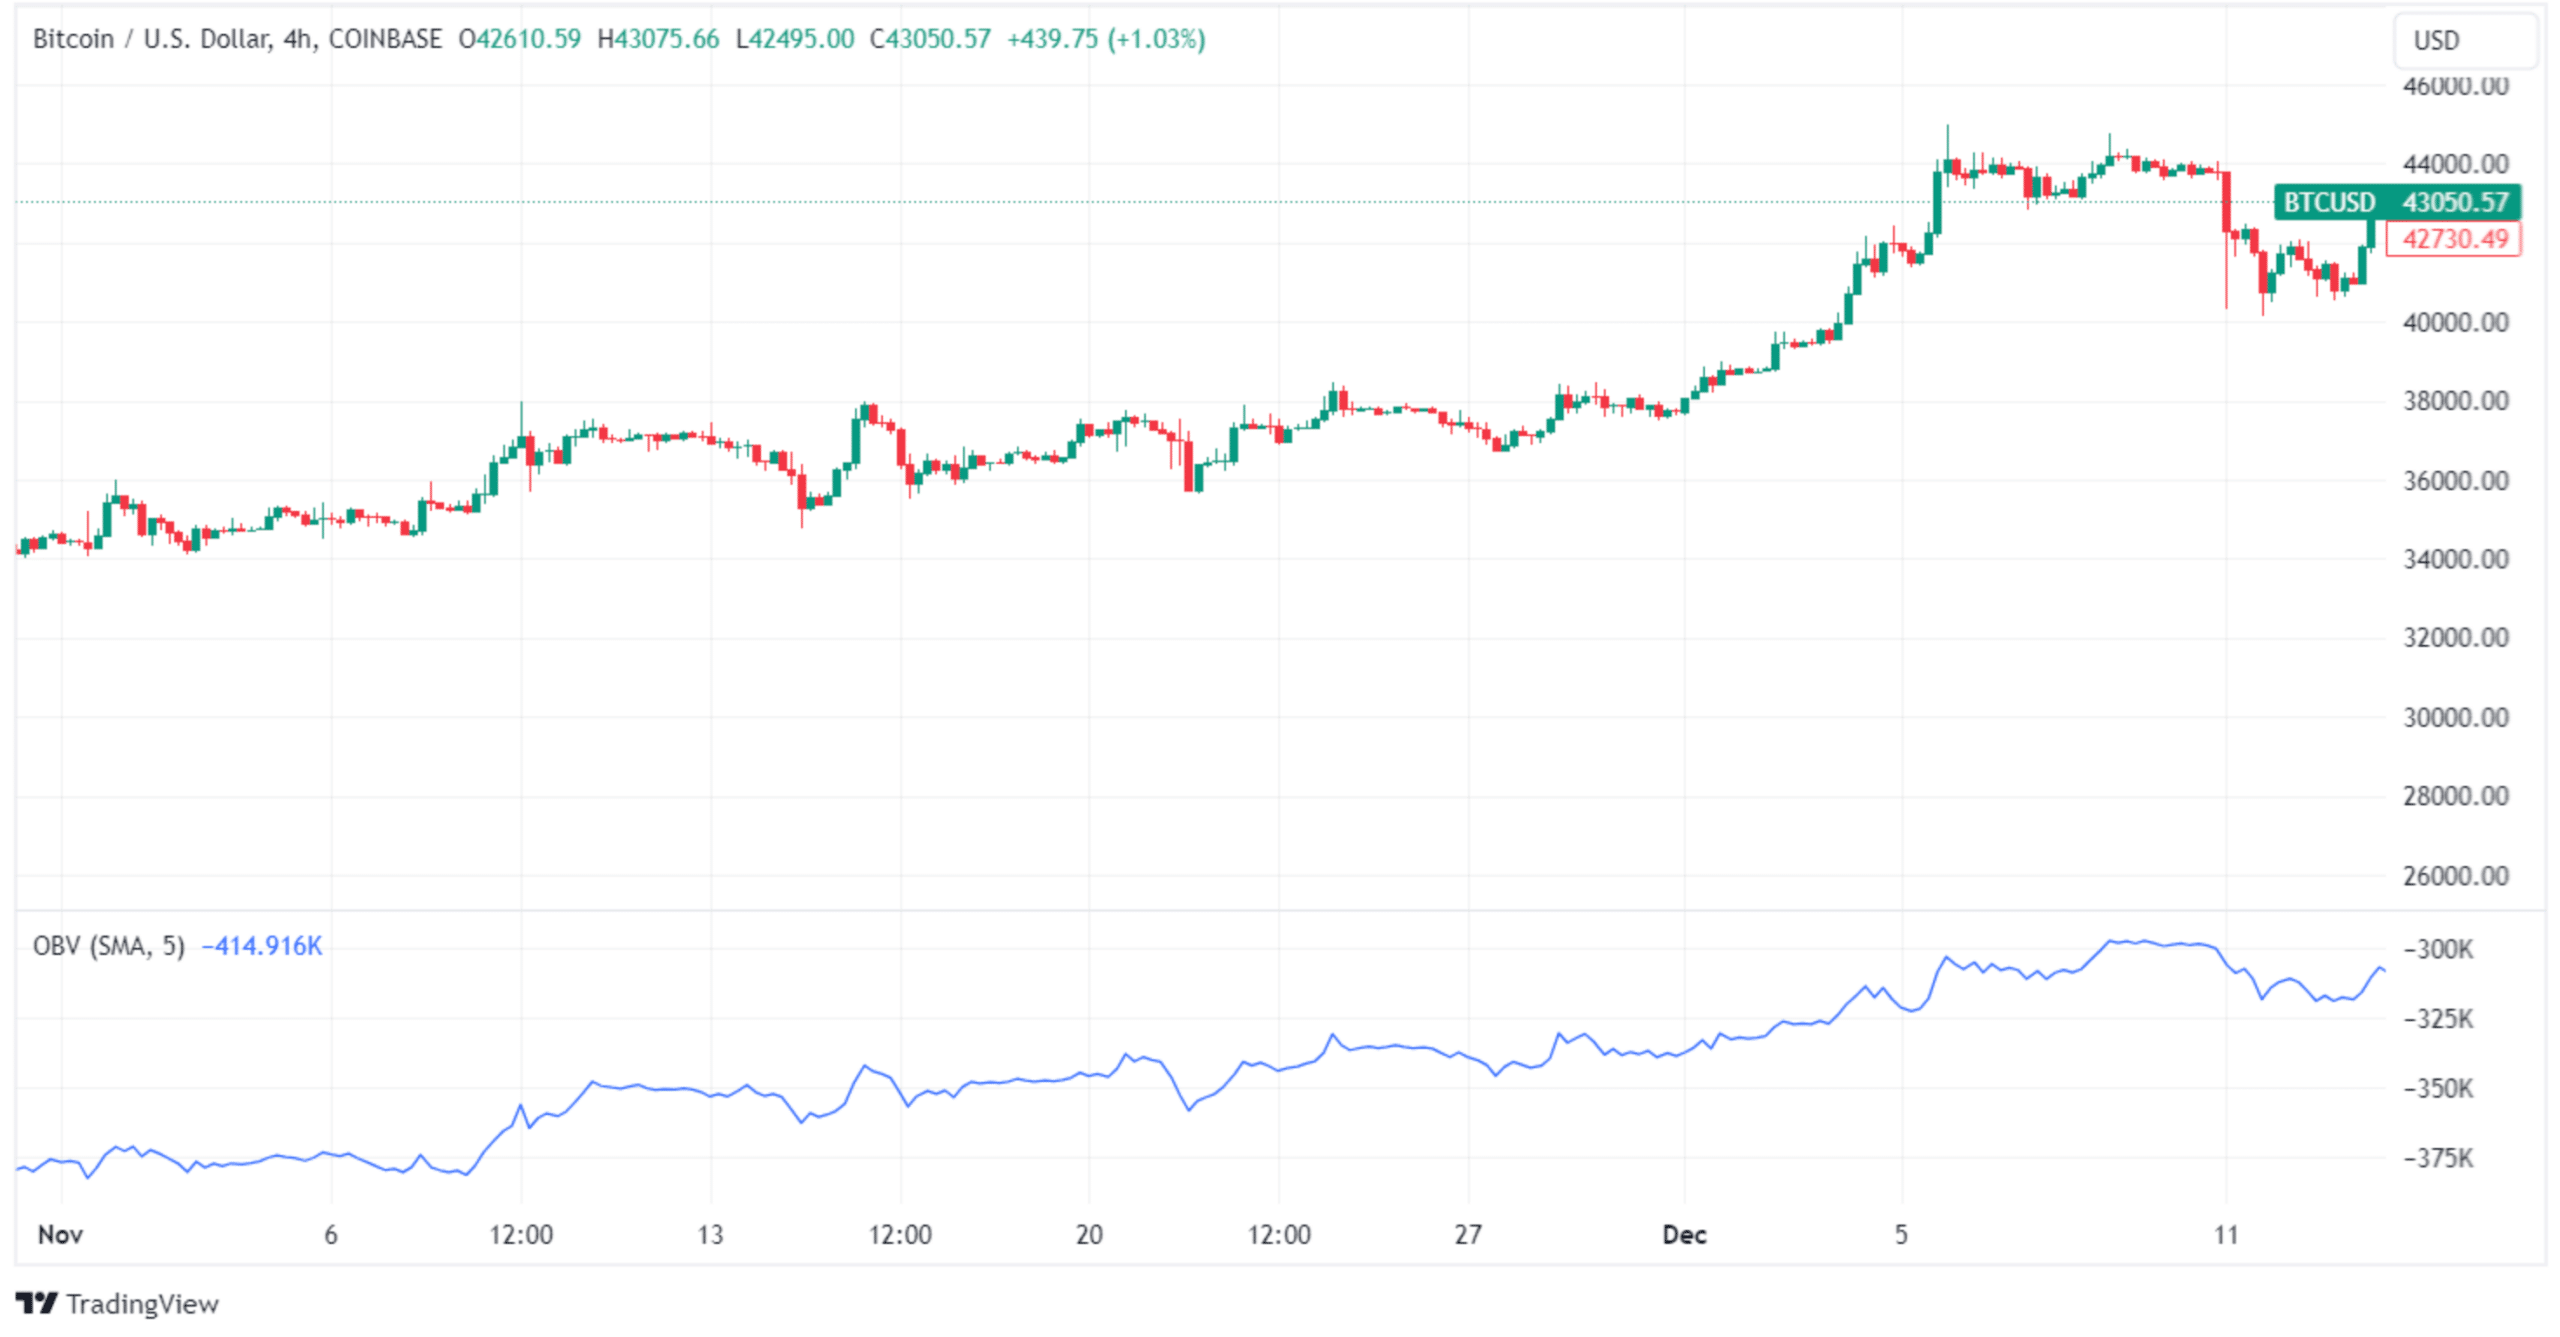
Bonus: On-Balance Volume (OBV)
Measures buying and selling pressure using cumulative volume
Strong trend indicator when price and OBV direction align; useful in confirming trend strength
Many crypto traders also prefer the OBV indicator, which is based on trading volume. It is a cumulative indicator that measures buying and selling pressure. It’s calculated by adding the volume on bullish days and subtracting the volume on bearish days. A rising OBV suggests buying pressure, while a declining OBV points to selling pressure.
If both the price and OBV are heading in the same direction, it means that the current trend is strong, especially during uptrends.
There is no best technical indicator. Crypto traders use the indicators they prefer based on crypto market conditions. I prefer MACD because it is a universal indicator that can offer many relevant signals. You can use it to identify trends and assess market sentiment.
Indicators are used to analyze the market, but they cannot guarantee future price movements. The most reliable signals are confirmed by multiple indicators used in combination.
Trading Bitcoin (BTC) is no different than trading altcoins, so you can use the same technical indicators you prefer. Still, for Bitcoin trading, the signals may be more accurate due to higher volume and liquidity.
You should combine technical indicators to create a reliable trading strategy. For example, you can use moving averages to determine the trend and the Relative Strength Index to determine momentum.
6+ years of experience writing for crypto brands and blockchain firms, including Coindesk, Cointelegraph, Bitcoinist, CryptoPotato, Algorand, and OTCTrade.com